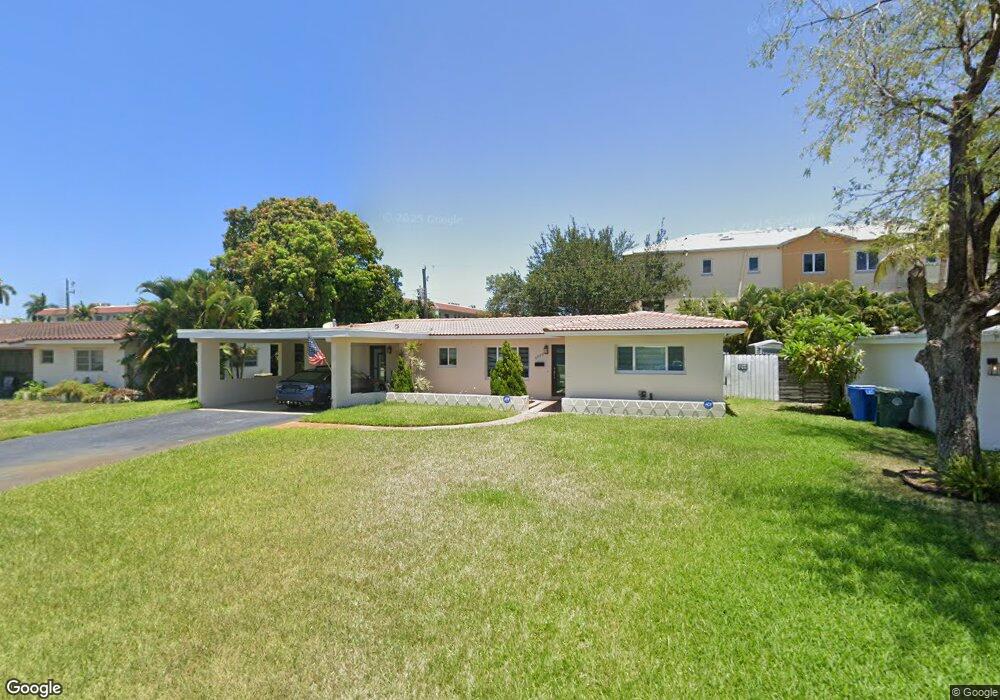
4020 NE 18th Ave Oakland Park, FL 33334
Central Corals NeighborhoodEstimated Value: $634,168 - $778,000
3
Beds
2
Baths
1,707
Sq Ft
$407/Sq Ft
Est. Value
About This Home
This home is located at 4020 NE 18th Ave, Oakland Park, FL 33334 and is currently estimated at $695,042, approximately $407 per square foot. 4020 NE 18th Ave is a home located in Broward County with nearby schools including Oakland Park Elementary School, James S. Rickards Middle School, and Northeast High School.
Ownership History
Date
Name
Owned For
Owner Type
Purchase Details
Closed on
Aug 26, 2020
Sold by
Carbo Andre
Bought by
Carbo Andre and Avellaneda Nelyda Marlene
Current Estimated Value
Home Financials for this Owner
Home Financials are based on the most recent Mortgage that was taken out on this home.
Original Mortgage
$190,000
Outstanding Balance
$152,587
Interest Rate
3%
Mortgage Type
New Conventional
Estimated Equity
$542,455
Purchase Details
Closed on
Feb 19, 2010
Sold by
Avellaneda Nelyda M
Bought by
Carbo Andre
Home Financials for this Owner
Home Financials are based on the most recent Mortgage that was taken out on this home.
Original Mortgage
$166,920
Interest Rate
5.37%
Mortgage Type
FHA
Purchase Details
Closed on
Nov 8, 1994
Sold by
Zuluaga Juan
Bought by
Avellaneda Nelyda M
Purchase Details
Closed on
Oct 18, 1994
Sold by
Hincapie Guillermo
Bought by
Zuluaga Juan
Purchase Details
Closed on
Feb 1, 1992
Sold by
Available Not
Bought by
Available Not
Create a Home Valuation Report for This Property
The Home Valuation Report is an in-depth analysis detailing your home's value as well as a comparison with similar homes in the area
Home Values in the Area
Average Home Value in this Area
Purchase History
| Date | Buyer | Sale Price | Title Company |
|---|---|---|---|
| Carbo Andre | $68,600 | Town & Country Ttl Guaranty | |
| Carbo Andre | $170,000 | Capital Abstract & Title | |
| Avellaneda Nelyda M | -- | -- | |
| Zuluaga Juan | $108,500 | -- | |
| Available Not | $85,714 | -- |
Source: Public Records
Mortgage History
| Date | Status | Borrower | Loan Amount |
|---|---|---|---|
| Open | Carbo Andre | $190,000 | |
| Previous Owner | Carbo Andre | $166,920 | |
| Closed | Zuluaga Juan | $0 |
Source: Public Records
Tax History Compared to Growth
Tax History
| Year | Tax Paid | Tax Assessment Tax Assessment Total Assessment is a certain percentage of the fair market value that is determined by local assessors to be the total taxable value of land and additions on the property. | Land | Improvement |
|---|---|---|---|---|
| 2025 | $4,661 | $235,270 | -- | -- |
| 2024 | $4,459 | $228,640 | -- | -- |
| 2023 | $4,459 | $221,990 | $0 | $0 |
| 2022 | $4,221 | $215,530 | $0 | $0 |
| 2021 | $4,028 | $209,260 | $0 | $0 |
| 2020 | $3,889 | $206,380 | $0 | $0 |
| 2019 | $3,763 | $201,740 | $0 | $0 |
| 2018 | $3,615 | $197,980 | $0 | $0 |
| 2017 | $3,597 | $193,910 | $0 | $0 |
| 2016 | $3,589 | $189,930 | $0 | $0 |
| 2015 | $3,649 | $188,610 | $0 | $0 |
| 2014 | $3,667 | $187,120 | $0 | $0 |
| 2013 | -- | $193,170 | $88,060 | $105,110 |
Source: Public Records
Map
Nearby Homes
- 4010 NE 18th Ave
- 4017 NE 18th Ave
- 1861 Coral Heights Blvd Unit 502
- 4021 NE 17th Terrace
- 1951 Coral Heights Blvd Unit 402
- 1711 NE 40th Ct
- 4025 N Federal Hwy Unit 226C
- 4025 N Federal Hwy Unit 224B
- 4025 N Federal Hwy Unit 324C
- 4025 N Federal Hwy Unit 312A
- 1911 NE 41st St
- 1611 NE 40th Place
- 3900 NE 18th Ave Unit 36H
- 4110 NE 20th Ave
- 4120 NE 20th Ave
- 1831 NE 38th St Unit 402
- 1831 NE 38th St Unit 410
- 1831 NE 38th St Unit 207
- 4100 NE 16th Terrace
- 3909 NE 21st Ave Unit 1
- 4030 NE 18th Ave
- 3999 Coral Heights Way Unit 1106
- 3999 Coral Heights Way
- 3991 Coral Heights Way Unit 1105
- 3981 Coral Heights Way Unit 1104
- 4040 NE 18th Ave
- 4000 NE 18th Ave
- 3971 Coral Heights Way Unit 1103
- 3961 Coral Heights Way Unit 1102
- 4011 NE 18th Ave
- 3951 Coral Heights Way Unit 1101
- 1801 Coral Heights Blvd
- 3982 Coral Heights Way
- 4021 NE 18th Ave
- 1811 Coral Heights Blvd Unit 507
- 3921 Coral Heights Way Unit 1003
- 1821 Coral Heights Blvd
- 1821 Coral Heights Blvd Unit 506
- 1750 NE 40th Place
- 3941 Coral Heights Way Unit 3941