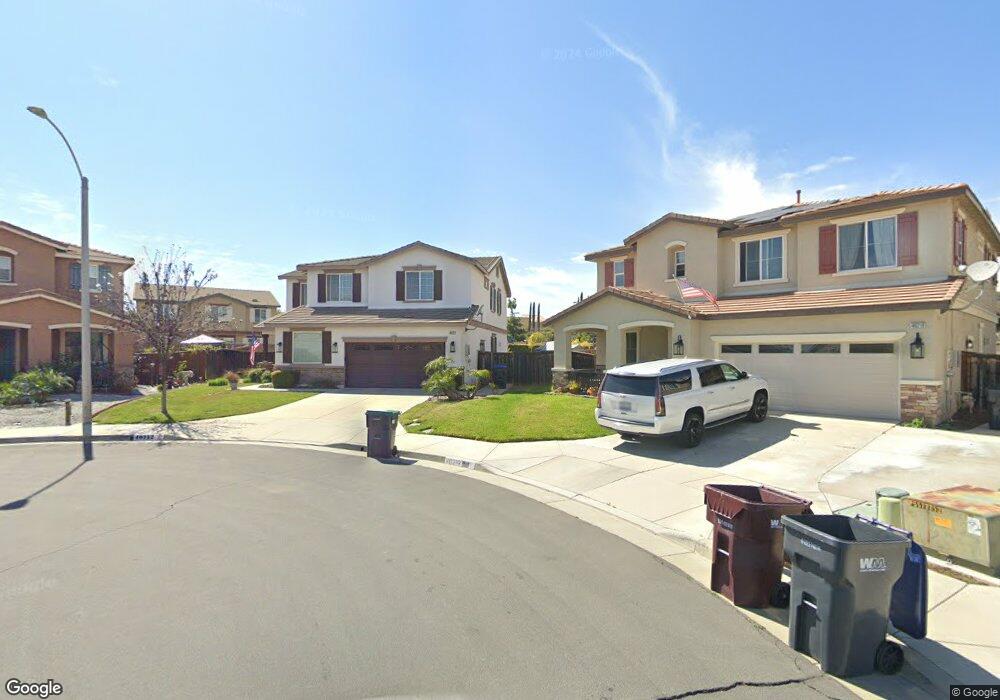
40222 Miriam Way Murrieta, CA 92563
Estimated Value: $758,000 - $844,000
4
Beds
3
Baths
3,233
Sq Ft
$250/Sq Ft
Est. Value
About This Home
This home is located at 40222 Miriam Way, Murrieta, CA 92563 and is currently estimated at $807,373, approximately $249 per square foot. 40222 Miriam Way is a home located in Riverside County with nearby schools including Alta Murrieta Elementary School, Warm Springs Middle School, and Vista Murrieta High School.
Ownership History
Date
Name
Owned For
Owner Type
Purchase Details
Closed on
Sep 9, 2019
Sold by
Levine Leonard J
Bought by
Levine Leonard J and Levine Sahara
Current Estimated Value
Home Financials for this Owner
Home Financials are based on the most recent Mortgage that was taken out on this home.
Original Mortgage
$469,000
Outstanding Balance
$409,960
Interest Rate
3.5%
Mortgage Type
VA
Estimated Equity
$397,413
Purchase Details
Closed on
Mar 9, 2006
Sold by
Centex Homes
Bought by
Levine Leonard J
Home Financials for this Owner
Home Financials are based on the most recent Mortgage that was taken out on this home.
Original Mortgage
$49,999
Interest Rate
6.19%
Mortgage Type
Stand Alone Second
Purchase Details
Closed on
Mar 6, 2006
Sold by
Le Vine Sahara
Bought by
Le Vine Leonard J
Home Financials for this Owner
Home Financials are based on the most recent Mortgage that was taken out on this home.
Original Mortgage
$49,999
Interest Rate
6.19%
Mortgage Type
Stand Alone Second
Create a Home Valuation Report for This Property
The Home Valuation Report is an in-depth analysis detailing your home's value as well as a comparison with similar homes in the area
Home Values in the Area
Average Home Value in this Area
Purchase History
| Date | Buyer | Sale Price | Title Company |
|---|---|---|---|
| Levine Leonard J | -- | Wfg National Title Company | |
| Levine Leonard J | $500,000 | None Available | |
| Le Vine Leonard J | -- | Commerce Title Company |
Source: Public Records
Mortgage History
| Date | Status | Borrower | Loan Amount |
|---|---|---|---|
| Open | Levine Leonard J | $469,000 | |
| Closed | Levine Leonard J | $49,999 | |
| Closed | Le Vine Leonard J | $399,992 |
Source: Public Records
Tax History Compared to Growth
Tax History
| Year | Tax Paid | Tax Assessment Tax Assessment Total Assessment is a certain percentage of the fair market value that is determined by local assessors to be the total taxable value of land and additions on the property. | Land | Improvement |
|---|---|---|---|---|
| 2025 | $10,621 | $756,229 | $245,971 | $510,258 |
| 2023 | $10,621 | $726,866 | $236,421 | $490,445 |
| 2022 | $10,711 | $712,615 | $231,786 | $480,829 |
| 2021 | $9,019 | $562,680 | $184,761 | $377,919 |
| 2020 | $8,379 | $502,393 | $164,965 | $337,428 |
| 2019 | $8,282 | $487,760 | $160,160 | $327,600 |
| 2018 | $8,122 | $469,000 | $154,000 | $315,000 |
| 2017 | $9,134 | $427,000 | $140,000 | $287,000 |
| 2016 | $8,920 | $409,000 | $134,000 | $275,000 |
| 2015 | $8,966 | $403,000 | $132,000 | $271,000 |
| 2014 | $8,815 | $400,000 | $131,000 | $269,000 |
Source: Public Records
Map
Nearby Homes
- 40027 Daphne Dr
- 26330 Norma Jean Place
- 40412 Jacob Way
- 25720 Marvick Way
- 40365 Calle Real
- 40358 Calle Real
- 40344 Calle Real
- 40688 La Salle Place
- 25943 Summer Hill Ct
- 26054 Pine St
- 26133 Williams Way Unit C
- 40223 Sequoia St
- 25933 Schafer Dr
- 25552 Blackwood Rd
- 26154 Williams Way Unit B
- 39738 Columbia Union Dr Unit B
- 39938 Pearl Dr
- 39572 Ramshorn Dr
- 40542 Calla Lilly St
- 39635 Columbia Union Dr Unit C
- 40219 Miriam Way
- 26300 Avery Place
- 40210 Miriam Way
- 26288 Avery Place
- 40207 Miriam Way
- 26276 Avery Place
- 40198 Miriam Way
- 40195 Miriam Way
- 26312 Avery Place
- 26264 Avery Place
- 40186 Miriam Way
- 40174 Miriam Way
- 40183 Miriam Way
- 26252 Avery Place
- 40162 Miriam Way
- 26315 Avery Place
- 40171 Miriam Way
- 26303 Avery Place
- 40150 Miriam Way
- 26291 Avery Place