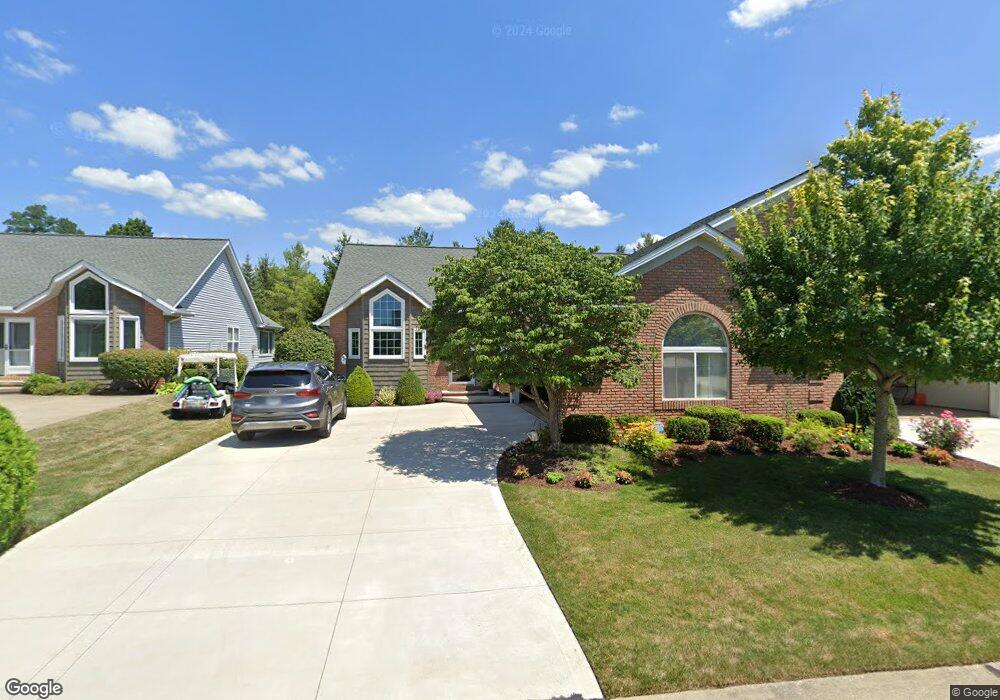
4023 Dogleg Trail Medina, OH 44256
Estimated Value: $381,000 - $424,000
2
Beds
3
Baths
1,705
Sq Ft
$234/Sq Ft
Est. Value
About This Home
This home is located at 4023 Dogleg Trail, Medina, OH 44256 and is currently estimated at $398,572, approximately $233 per square foot. 4023 Dogleg Trail is a home located in Medina County with nearby schools including Eliza Northrop Elementary School, Claggett Middle School, and Medina High School.
Ownership History
Date
Name
Owned For
Owner Type
Purchase Details
Closed on
Aug 15, 2006
Sold by
Farebrother Mary E
Bought by
Farebrother Thomas A
Current Estimated Value
Home Financials for this Owner
Home Financials are based on the most recent Mortgage that was taken out on this home.
Original Mortgage
$65,000
Interest Rate
6.78%
Mortgage Type
Future Advance Clause Open End Mortgage
Purchase Details
Closed on
Apr 28, 2003
Sold by
Geith Kim M and Geith Paul
Bought by
Farebrother Thomas A and Farebrother Mary E
Purchase Details
Closed on
Nov 29, 1999
Sold by
Courts Of Weymouth Development and Ltd The
Bought by
Geith Kim M
Home Financials for this Owner
Home Financials are based on the most recent Mortgage that was taken out on this home.
Original Mortgage
$163,600
Interest Rate
7%
Create a Home Valuation Report for This Property
The Home Valuation Report is an in-depth analysis detailing your home's value as well as a comparison with similar homes in the area
Home Values in the Area
Average Home Value in this Area
Purchase History
| Date | Buyer | Sale Price | Title Company |
|---|---|---|---|
| Farebrother Thomas A | -- | -- | |
| Farebrother Thomas A | $200,000 | -- | |
| Geith Kim M | $197,200 | -- |
Source: Public Records
Mortgage History
| Date | Status | Borrower | Loan Amount |
|---|---|---|---|
| Previous Owner | Solgos Garry T | $58,000 | |
| Previous Owner | Solgos Garry T | $125,000 | |
| Previous Owner | Farebrother Thomas A | $65,000 | |
| Previous Owner | Rodio Kim M | $39,900 | |
| Previous Owner | Geith Kim M | $163,600 |
Source: Public Records
Tax History Compared to Growth
Tax History
| Year | Tax Paid | Tax Assessment Tax Assessment Total Assessment is a certain percentage of the fair market value that is determined by local assessors to be the total taxable value of land and additions on the property. | Land | Improvement |
|---|---|---|---|---|
| 2024 | $4,703 | $101,850 | $25,170 | $76,680 |
| 2023 | $4,703 | $101,850 | $25,170 | $76,680 |
| 2022 | $4,100 | $101,850 | $25,170 | $76,680 |
| 2021 | $3,985 | $85,070 | $20,300 | $64,770 |
| 2020 | $4,018 | $85,070 | $20,300 | $64,770 |
| 2019 | $4,026 | $85,070 | $20,300 | $64,770 |
| 2018 | $3,386 | $68,360 | $17,920 | $50,440 |
| 2017 | $3,432 | $68,360 | $17,920 | $50,440 |
| 2016 | $3,510 | $68,360 | $17,920 | $50,440 |
| 2015 | $3,484 | $65,100 | $17,060 | $48,040 |
| 2014 | $3,476 | $65,100 | $17,060 | $48,040 |
| 2013 | $3,480 | $65,100 | $17,060 | $48,040 |
Source: Public Records
Map
Nearby Homes
- 3674 Fenn Rd
- 3777 Crimson Harvest Ln
- 3874 Crimson Harvest Ln
- 3621 Hidden Canyon Trail
- 3676 Huffman Rd
- 3667 Eagle Point Ct
- SL #7 Falcon Ridge Dr
- SL #6 Falcon Ridge Dr
- 3966 Granger Rd
- 3840 Deer Lake Dr
- 3465 Hunting Run Rd
- 4034 Nichols Rd
- 4396 Gladden Place
- 3694 Nichols Rd
- 4336 Gladden Place
- 3949 Remsen Rd
- 4550 Weymouth Rd
- 4901 Greenleaf Way
- 3276 Hardwood Hollow Rd
- 3085 Hamlin Rd
- 4029 Dogleg Trail
- 4019 Dogleg Trail
- 4013 Dogleg Trail
- 4024 Dogleg Trail
- 4007 Dogleg Trail
- 4030 Dogleg Trail
- 4020 Dogleg Trail
- 4014 Dogleg Trail
- 3584 Greenview Dr
- 4008 Dogleg Trail
- 3588 Greenview Dr
- 4004 Dogleg Trail
- 3999 Dogleg Trail
- 3598 Greenview Dr
- 3993 Dogleg Trail
- 4000 Dogleg Trail
- 3994 Dogleg Trail
- 4035 Pierce Rd
- 4041 Sandview Dr
- 4045 Sandview Dr