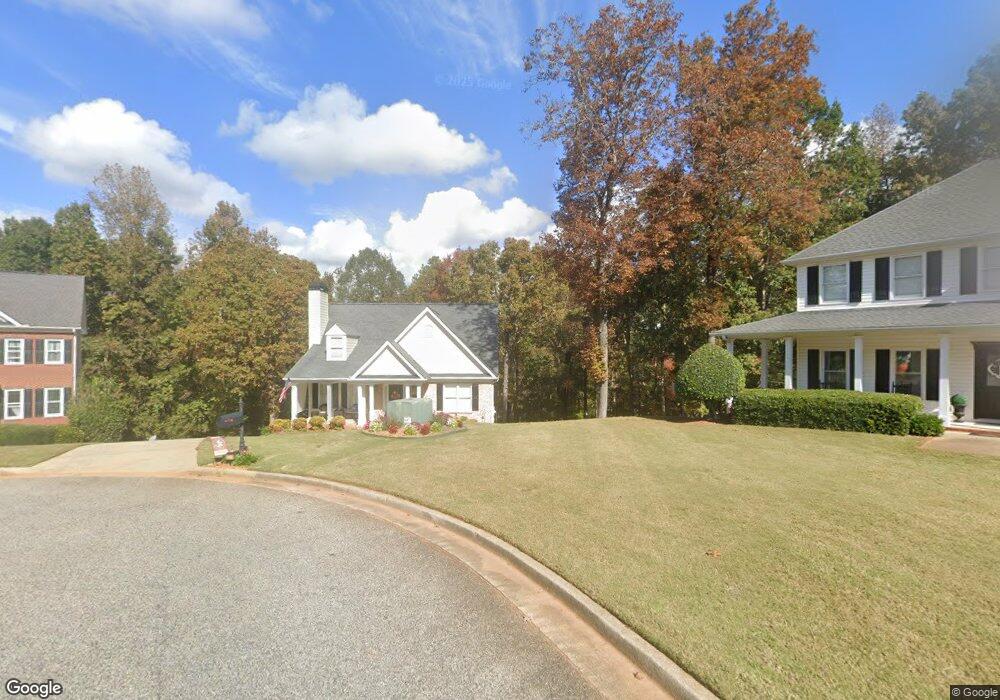
4024 Derby Dr Gainesville, GA 30507
Estimated Value: $361,642 - $478,000
3
Beds
2
Baths
1,949
Sq Ft
$215/Sq Ft
Est. Value
About This Home
This home is located at 4024 Derby Dr, Gainesville, GA 30507 and is currently estimated at $419,161, approximately $215 per square foot. 4024 Derby Dr is a home located in Hall County with nearby schools including Chestnut Mountain Elementary School, Cherokee Bluff Middle School, and Cherokee Bluff High School.
Ownership History
Date
Name
Owned For
Owner Type
Purchase Details
Closed on
Oct 26, 2001
Sold by
Rothschild Stephen F and Rothschild Lisa T
Bought by
Pennell Matthew and Pennell Suzanne
Current Estimated Value
Home Financials for this Owner
Home Financials are based on the most recent Mortgage that was taken out on this home.
Original Mortgage
$160,000
Outstanding Balance
$61,059
Interest Rate
6.85%
Mortgage Type
New Conventional
Estimated Equity
$358,102
Purchase Details
Closed on
Nov 26, 1997
Sold by
Darryl Crow Constr Co Inc
Bought by
Rothschild Stephen F and Rothschild Lisa T
Home Financials for this Owner
Home Financials are based on the most recent Mortgage that was taken out on this home.
Original Mortgage
$117,500
Interest Rate
7.35%
Mortgage Type
New Conventional
Purchase Details
Closed on
Apr 1, 1997
Create a Home Valuation Report for This Property
The Home Valuation Report is an in-depth analysis detailing your home's value as well as a comparison with similar homes in the area
Home Values in the Area
Average Home Value in this Area
Purchase History
| Date | Buyer | Sale Price | Title Company |
|---|---|---|---|
| Pennell Matthew | $174,000 | -- | |
| Rothschild Stephen F | $146,900 | -- | |
| -- | $13,000 | -- |
Source: Public Records
Mortgage History
| Date | Status | Borrower | Loan Amount |
|---|---|---|---|
| Open | Pennell Matthew | $160,000 | |
| Previous Owner | Rothschild Stephen F | $117,500 |
Source: Public Records
Tax History Compared to Growth
Tax History
| Year | Tax Paid | Tax Assessment Tax Assessment Total Assessment is a certain percentage of the fair market value that is determined by local assessors to be the total taxable value of land and additions on the property. | Land | Improvement |
|---|---|---|---|---|
| 2025 | $2,784 | $125,200 | $10,760 | $114,440 |
| 2024 | $3,015 | $121,080 | $10,760 | $110,320 |
| 2023 | $2,480 | $115,280 | $10,760 | $104,520 |
| 2022 | $2,523 | $97,080 | $10,760 | $86,320 |
| 2021 | $2,415 | $91,240 | $10,760 | $80,480 |
| 2020 | $2,378 | $87,320 | $10,760 | $76,560 |
| 2019 | $2,269 | $82,560 | $10,760 | $71,800 |
| 2018 | $2,265 | $79,800 | $10,760 | $69,040 |
| 2017 | $1,959 | $69,640 | $10,760 | $58,880 |
| 2016 | $1,655 | $60,164 | $7,760 | $52,404 |
| 2015 | $1,668 | $60,164 | $7,760 | $52,404 |
| 2014 | $1,668 | $60,164 | $7,760 | $52,404 |
Source: Public Records
Map
Nearby Homes
- 5321 Shadow Walk Way
- 5322 Windridge Pkwy Unit 18A
- 5326 Windridge Pkwy Unit 19A
- 5326 Windridge Pkwy
- 5387 Ponderosa Farm Rd
- 5339 Milford Dr Unit 205A
- 5339 Milford Dr
- 5330 Windridge Pkwy Unit 20A
- 5334 Windridge Pkwy
- 5330 Windridge Pkwy
- 5334 Windridge Pkwy Unit 21A
- 5252 Baymont Dr Unit 30A
- 5259 Baymont Dr Unit 159A
- 5263 Baymont Dr Unit 158A
- 5248 Baymont Dr Unit 29A
- 5251 Baymont Dr Unit 161A
- 5259 Baymont Dr
- 5251 Baymont Dr
- 5248 Baymont Dr
- 5263 Baymont Dr
- 4027 Derby Dr
- 4020 Derby Dr
- 4016 Derby Dr
- 4017 Derby Dr
- 4076 Churchill Downs Dr
- 4009 Derby Dr Unit 16
- 4009 Derby Dr
- 4012 Derby Dr
- 0 Derby Dr Unit 8587808
- 0 Derby Dr Unit 8466770
- 0 Derby Dr
- 4069 Churchill Downs Dr
- 4065 Churchill Downs Dr
- 4073 Churchill Downs Dr
- 4008 Derby Dr
- 3957 Kilgore Falls Dr
- 4061 Churchill Downs Dr
- 4077 Churchill Downs Dr
- 0 Churchill Downs Dr Unit 3249980
- 4052 Churchill Downs Dr