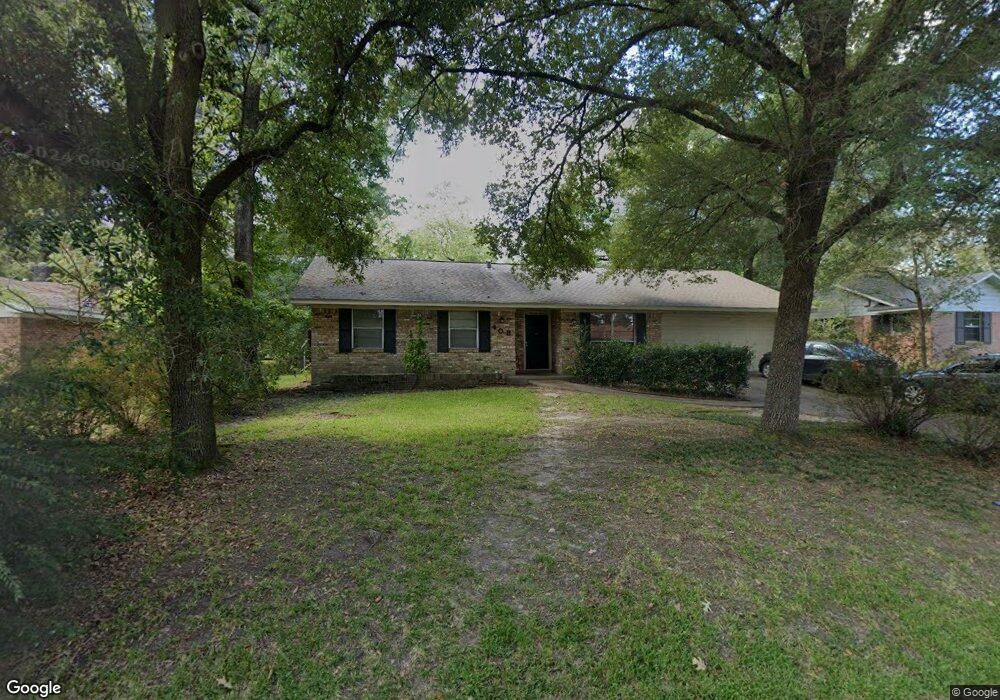
403 Greenbriar Dr Lufkin, TX 75901
Estimated Value: $124,185 - $175,000
3
Beds
2
Baths
1,400
Sq Ft
$103/Sq Ft
Est. Value
About This Home
This home is located at 403 Greenbriar Dr, Lufkin, TX 75901 and is currently estimated at $144,046, approximately $102 per square foot. 403 Greenbriar Dr is a home located in Angelina County with nearby schools including Herty Primary School, Coston Elementary School, and Lufkin Middle School.
Ownership History
Date
Name
Owned For
Owner Type
Purchase Details
Closed on
Sep 16, 2007
Sold by
Moore Bosque
Bought by
Kilgore Charles and Kilgore Linda
Current Estimated Value
Purchase Details
Closed on
May 26, 2005
Sold by
Secretary Of Veterans Affairs
Bought by
Moore Bosque
Home Financials for this Owner
Home Financials are based on the most recent Mortgage that was taken out on this home.
Original Mortgage
$51,000
Interest Rate
5.79%
Mortgage Type
VA
Purchase Details
Closed on
Feb 7, 2005
Sold by
Bank Of America Na
Bought by
Secretary Of Veterans Affairs
Purchase Details
Closed on
Jan 10, 2005
Sold by
Bank Of America Na
Bought by
Secretary Of Veterans Affairs
Purchase Details
Closed on
Jan 4, 2005
Sold by
Daffin Barrett Burke Wilson Castle and Daffin Fra
Bought by
Bank Of America Na
Create a Home Valuation Report for This Property
The Home Valuation Report is an in-depth analysis detailing your home's value as well as a comparison with similar homes in the area
Home Values in the Area
Average Home Value in this Area
Purchase History
| Date | Buyer | Sale Price | Title Company |
|---|---|---|---|
| Kilgore Charles | -- | None Available | |
| Moore Bosque | $51,000 | None Available | |
| Secretary Of Veterans Affairs | -- | None Available | |
| Secretary Of Veterans Affairs | -- | None Available | |
| Bank Of America Na | -- | None Available |
Source: Public Records
Mortgage History
| Date | Status | Borrower | Loan Amount |
|---|---|---|---|
| Previous Owner | Moore Bosque | $51,000 |
Source: Public Records
Tax History Compared to Growth
Tax History
| Year | Tax Paid | Tax Assessment Tax Assessment Total Assessment is a certain percentage of the fair market value that is determined by local assessors to be the total taxable value of land and additions on the property. | Land | Improvement |
|---|---|---|---|---|
| 2025 | $2,093 | $100,150 | $13,680 | $86,470 |
| 2024 | $2,077 | $99,380 | $13,680 | $85,700 |
| 2023 | $1,947 | $97,970 | $13,680 | $84,290 |
| 2022 | $2,154 | $94,550 | $6,940 | $87,610 |
| 2021 | $2,044 | $82,980 | $6,940 | $76,040 |
| 2020 | $1,729 | $70,370 | $6,940 | $63,430 |
| 2019 | $1,855 | $71,350 | $6,940 | $64,410 |
| 2018 | $1,597 | $69,120 | $6,940 | $62,180 |
| 2017 | $1,597 | $67,010 | $6,940 | $60,070 |
| 2016 | $1,638 | $68,730 | $6,940 | $61,790 |
| 2015 | $1,573 | $68,730 | $6,940 | $61,790 |
| 2014 | $1,573 | $69,870 | $6,940 | $62,930 |
Source: Public Records
Map
Nearby Homes
- 1902 Pine Burr St
- 2105 Paul Ave
- 505 Brasell St
- 2000 Paul Ave
- 1911 Paul Ave
- 916 Circle Dr
- 2401 Paul Ave
- 1603 Atkinson Dr
- 4344 N Highway 69
- R22597 N Highway 69
- TBD N Highway 69
- 0 N Highway 69
- 2549 N Highway 69
- 1618 Paul Ave
- 607 Humason Ave
- 417 Stark St
- 2515 Atkinson Dr Unit 26012611
- 329 Humason Ave
- 333 Humason Ave
- 2114 E Lufkin Ave
- 405 Greenbriar Dr
- 401 Greenbriar Dr
- 402 Oleta Ave
- 402 Oleta St
- 402 402 Oleta Ave
- 404 Oleta Ave
- 400 Oleta Ave
- 407 Greenbriar Dr
- 402 Greenbriar Dr
- 404 Greenbriar Dr
- 400 Greenbriar Dr
- 406 Oleta Ave
- 412 Greenbriar Dr
- 409 Greenbriar Dr
- 1906 Pine Burr St
- 1904 Pine Burr St
- 408 Oleta St
- 1908 Pineburr St
- 408 Oleta Ave
- 1908 Pine Burr St