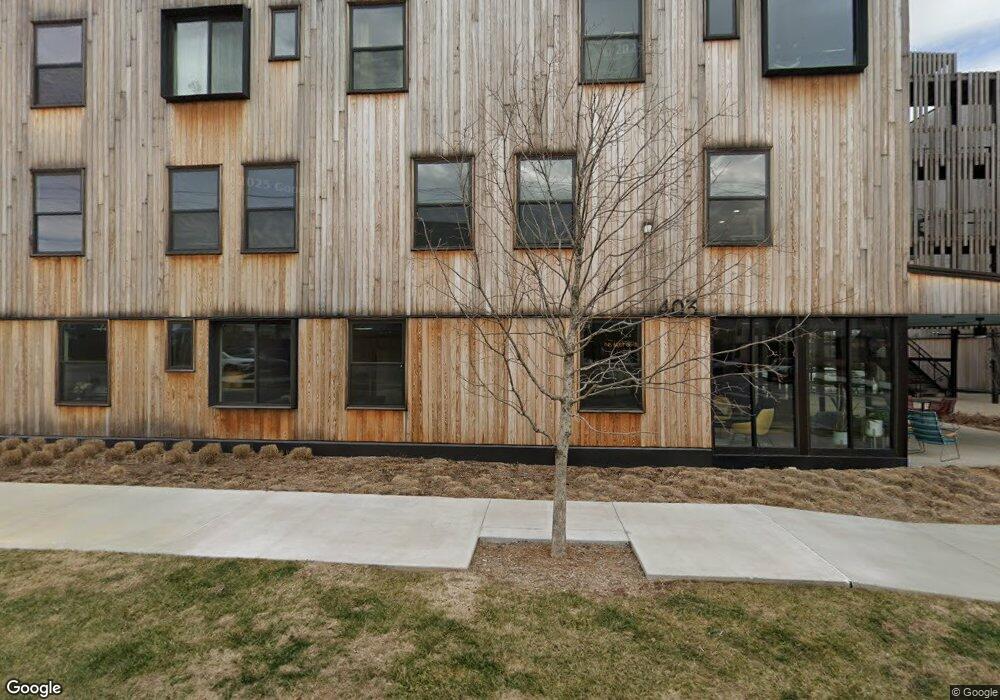
403 SE 3rd St Bentonville, AR 72712
Estimated Value: $1,581,000 - $1,964,000
--
Bed
1
Bath
3,832
Sq Ft
$455/Sq Ft
Est. Value
About This Home
This home is located at 403 SE 3rd St, Bentonville, AR 72712 and is currently estimated at $1,743,123, approximately $454 per square foot. 403 SE 3rd St is a home located in Benton County with nearby schools including R.E. Baker Elementary School, Old High Middle School, and Washington Junior High School.
Ownership History
Date
Name
Owned For
Owner Type
Purchase Details
Closed on
Jun 11, 2021
Sold by
Malashock Ryan D and Malashock Michelle L
Bought by
Simpson Scott and Simpson Barbara
Current Estimated Value
Home Financials for this Owner
Home Financials are based on the most recent Mortgage that was taken out on this home.
Original Mortgage
$960,000
Outstanding Balance
$865,365
Interest Rate
2.9%
Mortgage Type
New Conventional
Estimated Equity
$877,758
Purchase Details
Closed on
May 27, 2010
Sold by
Jones Robbie and Jones Patricia A
Bought by
Becker Melinda L
Home Financials for this Owner
Home Financials are based on the most recent Mortgage that was taken out on this home.
Original Mortgage
$123,339
Interest Rate
4.75%
Mortgage Type
FHA
Purchase Details
Closed on
Dec 21, 2004
Bought by
Jones
Purchase Details
Closed on
Dec 20, 2004
Bought by
Jones
Purchase Details
Closed on
Nov 14, 1990
Bought by
1St Am Sav
Purchase Details
Closed on
Nov 2, 1990
Bought by
Mitchell
Purchase Details
Closed on
May 7, 1980
Bought by
Hammack
Create a Home Valuation Report for This Property
The Home Valuation Report is an in-depth analysis detailing your home's value as well as a comparison with similar homes in the area
Home Values in the Area
Average Home Value in this Area
Purchase History
| Date | Buyer | Sale Price | Title Company |
|---|---|---|---|
| Simpson Scott | $1,200,000 | Liberty Title & Escrow | |
| Becker Melinda L | $125,000 | None Available | |
| Jones | $86,000 | -- | |
| Jones | $86,000 | -- | |
| 1St Am Sav | -- | -- | |
| Mitchell | $46,000 | -- | |
| Hammack | -- | -- |
Source: Public Records
Mortgage History
| Date | Status | Borrower | Loan Amount |
|---|---|---|---|
| Open | Simpson Scott | $960,000 | |
| Previous Owner | Becker Melinda L | $123,339 |
Source: Public Records
Tax History Compared to Growth
Tax History
| Year | Tax Paid | Tax Assessment Tax Assessment Total Assessment is a certain percentage of the fair market value that is determined by local assessors to be the total taxable value of land and additions on the property. | Land | Improvement |
|---|---|---|---|---|
| 2025 | $10,955 | $263,376 | $86,020 | $177,356 |
| 2024 | $10,358 | $260,892 | $86,020 | $174,872 |
| 2023 | $9,865 | $159,620 | $78,320 | $81,300 |
| 2022 | $9,729 | $159,620 | $78,320 | $81,300 |
| 2021 | $7,395 | $159,620 | $78,320 | $81,300 |
| 2020 | $7,080 | $117,030 | $48,610 | $68,420 |
| 2019 | $7,080 | $117,030 | $48,610 | $68,420 |
| 2018 | $7,105 | $117,030 | $48,610 | $68,420 |
| 2017 | $3,485 | $62,150 | $48,610 | $13,540 |
| 2016 | $3,485 | $62,150 | $48,610 | $13,540 |
| 2015 | $1,968 | $31,850 | $4,000 | $27,850 |
| 2014 | $1,618 | $31,850 | $4,000 | $27,850 |
Source: Public Records
Map
Nearby Homes
- 407 SW 3rd St
- 337 SE 3rd St
- 509 SE 3rd St
- _ Corner of Sw 3rd & Sw D St
- 400 SE Henry St
- 502 SW "E" St Unit 3
- 502 SW "E" St Unit 4
- 502 SW "E" St Unit 1
- 502 SW "E" St Unit 2
- 502 SW "E" St Unit 1-4
- 502 SW E St Unit 1
- 502 SW E St Unit 2
- 502 SE Henry St
- Lot 19 & 20 SE D St
- 504 SE Henry St
- 506 SE Henry St
- 508 SE Henry St
- 310 & 306 SE Henry St
- 310 SE Henry St
- 510 SE Henry St