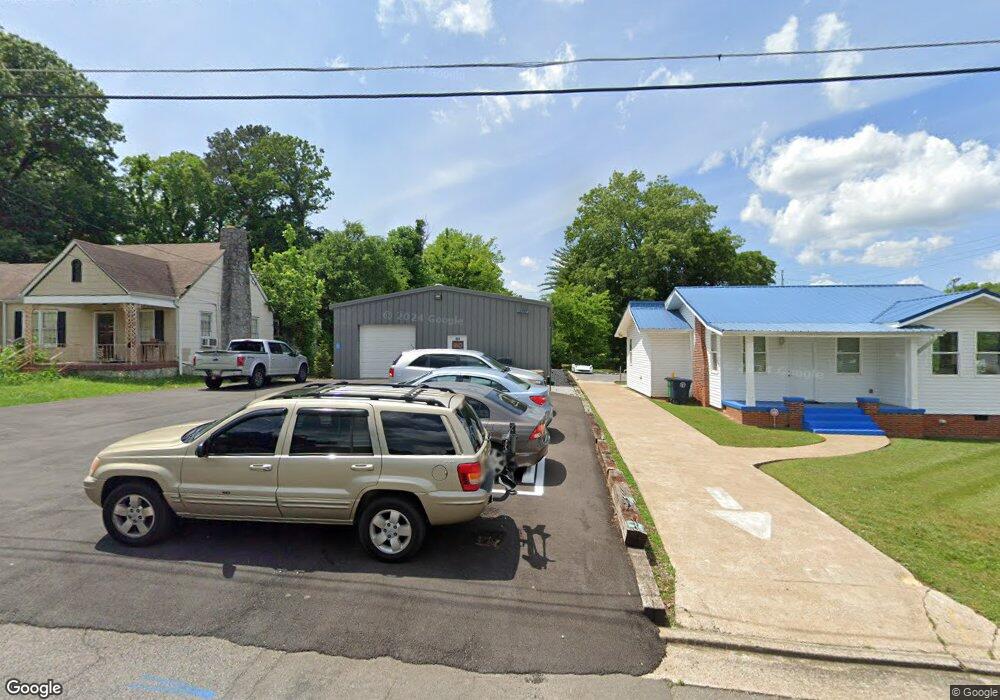
403 St Marks Ave East Ridge, TN 37412
Estimated Value: $29,038
2
Beds
1
Bath
1,080
Sq Ft
$27/Sq Ft
Est. Value
About This Home
This home is located at 403 St Marks Ave, East Ridge, TN 37412 and is currently priced at $29,038, approximately $26 per square foot. 403 St Marks Ave is a home located in Hamilton County with nearby schools including East Ridge Elementary School, East Ridge Middle School, and East Ridge High School.
Ownership History
Date
Name
Owned For
Owner Type
Purchase Details
Closed on
Jul 8, 2021
Sold by
Yogis Primopromo Llc
Bought by
Ypp Llc
Current Estimated Value
Home Financials for this Owner
Home Financials are based on the most recent Mortgage that was taken out on this home.
Original Mortgage
$200,000
Outstanding Balance
$181,469
Interest Rate
2.9%
Mortgage Type
Commercial
Purchase Details
Closed on
Mar 11, 2019
Sold by
Inspire Homes Llc
Bought by
Yogis Primopromo Llc
Purchase Details
Closed on
Jul 14, 2008
Sold by
Manning Floyd B
Bought by
Mccloud Goldia Faye
Purchase Details
Closed on
Jan 20, 2005
Sold by
Hill Mary F and Murphy Wendy Ann Denise
Bought by
Mccloud Goldia and Hill Mary F
Home Financials for this Owner
Home Financials are based on the most recent Mortgage that was taken out on this home.
Original Mortgage
$66,400
Interest Rate
8.2%
Mortgage Type
New Conventional
Purchase Details
Closed on
Jan 29, 2002
Sold by
Milligan Reynolds Guaranty Title Agency
Bought by
Hill Mary F and Mccloud Wendy Ann Denise
Create a Home Valuation Report for This Property
The Home Valuation Report is an in-depth analysis detailing your home's value as well as a comparison with similar homes in the area
Home Values in the Area
Average Home Value in this Area
Purchase History
| Date | Buyer | Sale Price | Title Company |
|---|---|---|---|
| Ypp Llc | -- | Team Title Services Llc | |
| Yogis Primopromo Llc | $16,500 | Boston National Ttl Agcy Llc | |
| Mccloud Goldia Faye | -- | None Available | |
| Mccloud Goldia | -- | Southern Title Llc | |
| Hill Mary F | -- | -- | |
| Milligan Reynolds Guaranty Title Agency | -- | -- |
Source: Public Records
Mortgage History
| Date | Status | Borrower | Loan Amount |
|---|---|---|---|
| Open | Ypp Llc | $200,000 | |
| Previous Owner | Mccloud Goldia | $66,400 |
Source: Public Records
Tax History Compared to Growth
Tax History
| Year | Tax Paid | Tax Assessment Tax Assessment Total Assessment is a certain percentage of the fair market value that is determined by local assessors to be the total taxable value of land and additions on the property. | Land | Improvement |
|---|---|---|---|---|
| 2024 | $2,253 | $100,720 | $0 | $0 |
| 2023 | $3,521 | $100,720 | $0 | $0 |
| 2022 | $305 | $8,750 | $0 | $0 |
| 2021 | $305 | $8,750 | $0 | $0 |
| 2020 | $337 | $3,825 | $0 | $0 |
| 2019 | $337 | $3,825 | $0 | $0 |
| 2018 | $337 | $3,825 | $0 | $0 |
| 2017 | $261 | $3,875 | $0 | $0 |
| 2016 | $342 | $0 | $0 | $0 |
| 2015 | $342 | $3,875 | $0 | $0 |
| 2014 | $947 | $0 | $0 | $0 |
Source: Public Records
Map
Nearby Homes
- 503 S Lovell Ave
- 305 Barbara Cir
- 616 S Moore Rd
- 5390 Reneau Way
- 4803 Madonna Ave
- 5207 Weaver St
- 207 S Lovell Ave
- 5398 Reneau Way
- 205 McBrien Rd
- 713 S Lovell Ave
- 1114 McBrien Rd
- 1119 McBrien Rd
- 104 S Saint Marks Ave
- 1110 Altamaha St
- 532 Wando Dr
- 514 Marlboro Ave
- 5318 Connell St
- 5309 Marion Ave
- 5333 Marion Ave
- 5417 Connell St
- 403 S Saint Marks Ave
- 405 S Saint Marks Ave
- 401 S Saint Marks Ave
- 407 S Saint Marks Ave
- 407 S St Marks Ave
- 414 S Lovell Ave
- 416 S Lovell Ave
- 411 S Saint Marks Ave
- 404 S Saint Marks Ave
- 402 S Saint Marks Ave
- 406 S Saint Marks Ave
- 418 S Lovell Ave
- 408 S Saint Marks Ave
- 408 S St Marks Ave
- 410 S Saint Marks Ave
- 420 S Lovell Ave
- 412 S Saint Marks Ave
- 501 S Saint Marks Ave
- 503 S St Marks Ave
- 503 S Saint Marks Ave