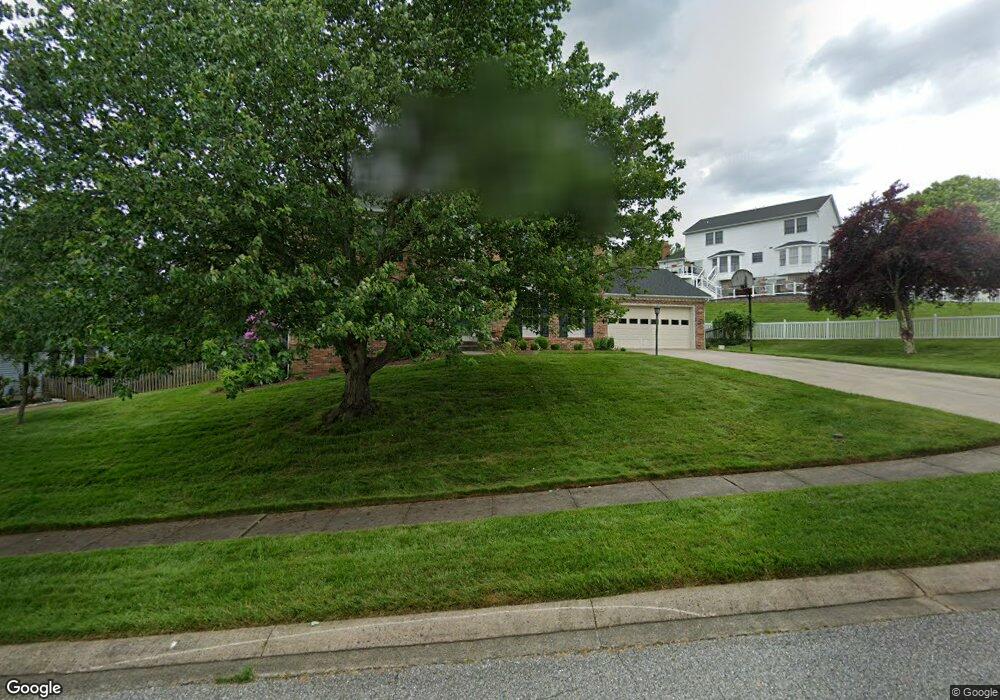
403 Sunny View Rd Bel Air, MD 21014
Estimated Value: $541,000 - $656,000
--
Bed
3
Baths
2,484
Sq Ft
$239/Sq Ft
Est. Value
About This Home
This home is located at 403 Sunny View Rd, Bel Air, MD 21014 and is currently estimated at $594,249, approximately $239 per square foot. 403 Sunny View Rd is a home located in Harford County with nearby schools including Homestead-Wakefield Elementary School, Bel Air Middle School, and Bel Air High School.
Ownership History
Date
Name
Owned For
Owner Type
Purchase Details
Closed on
Feb 9, 2021
Sold by
Snow Sharon L
Bought by
Snow Sharon L and Snow Stephen L
Current Estimated Value
Home Financials for this Owner
Home Financials are based on the most recent Mortgage that was taken out on this home.
Original Mortgage
$213,000
Outstanding Balance
$156,794
Interest Rate
2.7%
Mortgage Type
New Conventional
Estimated Equity
$437,455
Purchase Details
Closed on
Apr 25, 2013
Sold by
Snow Stephen L and Snow Sharon L
Bought by
Snow Sharon L
Home Financials for this Owner
Home Financials are based on the most recent Mortgage that was taken out on this home.
Original Mortgage
$282,000
Interest Rate
2.87%
Mortgage Type
Adjustable Rate Mortgage/ARM
Purchase Details
Closed on
Feb 23, 1998
Sold by
Mcneely Michael D
Bought by
Snow Stephen L and Snow Sharon L
Create a Home Valuation Report for This Property
The Home Valuation Report is an in-depth analysis detailing your home's value as well as a comparison with similar homes in the area
Home Values in the Area
Average Home Value in this Area
Purchase History
| Date | Buyer | Sale Price | Title Company |
|---|---|---|---|
| Snow Sharon L | -- | Powerhouse Title Group Llc | |
| Snow Sharon L | -- | North American Title Ins Co | |
| Snow Stephen L | $199,900 | -- |
Source: Public Records
Mortgage History
| Date | Status | Borrower | Loan Amount |
|---|---|---|---|
| Open | Snow Sharon L | $213,000 | |
| Closed | Snow Sharon L | $282,000 | |
| Closed | Snow Stephen L | -- |
Source: Public Records
Tax History Compared to Growth
Tax History
| Year | Tax Paid | Tax Assessment Tax Assessment Total Assessment is a certain percentage of the fair market value that is determined by local assessors to be the total taxable value of land and additions on the property. | Land | Improvement |
|---|---|---|---|---|
| 2025 | $4,962 | $474,200 | $113,000 | $361,200 |
| 2024 | $4,962 | $455,233 | $0 | $0 |
| 2023 | $4,755 | $436,267 | $0 | $0 |
| 2022 | $4,548 | $417,300 | $113,000 | $304,300 |
| 2021 | $4,446 | $401,300 | $0 | $0 |
| 2020 | $4,446 | $385,300 | $0 | $0 |
| 2019 | $4,262 | $369,300 | $120,600 | $248,700 |
| 2018 | $4,188 | $366,233 | $0 | $0 |
| 2017 | $4,153 | $369,300 | $0 | $0 |
| 2016 | -- | $360,100 | $0 | $0 |
| 2015 | $3,935 | $352,733 | $0 | $0 |
| 2014 | $3,935 | $345,367 | $0 | $0 |
Source: Public Records
Map
Nearby Homes
- 12 Overbrook Ln
- 4 Ashley Way
- 1039 Wingate Ct
- 1219 Starmount Ln
- 916 Cheswold Ct
- 906 Whispering Ridge Ln
- 1308 Saratoga Dr
- 1818 Selvin Dr Unit 202
- 1312 Scottsdale Dr Unit H
- 1314 Scottsdale Dr Unit G
- 1310 Scottsdale Dr Unit R
- 1600 Martha Ct Unit 304
- 1600 Martha Ct Unit 301
- 1307 Scottsdale Dr Unit J
- 1307 Scottsdale Dr Unit G
- 1308 Scottsdale Dr Unit L
- 1313 Kelsey Ct
- 1304 Scottsdale Dr Unit P
- 1309 Sheridan Place Unit 99
- 400 Idlewild Rd
- 405 Sunny View Rd
- 808 N Pine Ridge Ct
- 810 N Pine Ridge Ct
- 406 Sunny View Rd
- 404 Sunny View Rd
- 407 Sunny View Rd
- 812 N Pine Ridge Ct
- 408 Sunny View Rd
- 806 N Pine Ridge Ct
- 402 Sunny View Rd
- 410 Sunny View Rd
- 809 N Pine Ridge Ct
- 409 Sunny View Rd
- 807 N Pine Ridge Ct
- 418 E Ring Factory Rd
- 804 N Pine Ridge Ct
- 412 Sunny View Rd
- 805 N Pine Ridge Ct
- 420 E Ring Factory Rd
- 814 N Pine Ridge Ct