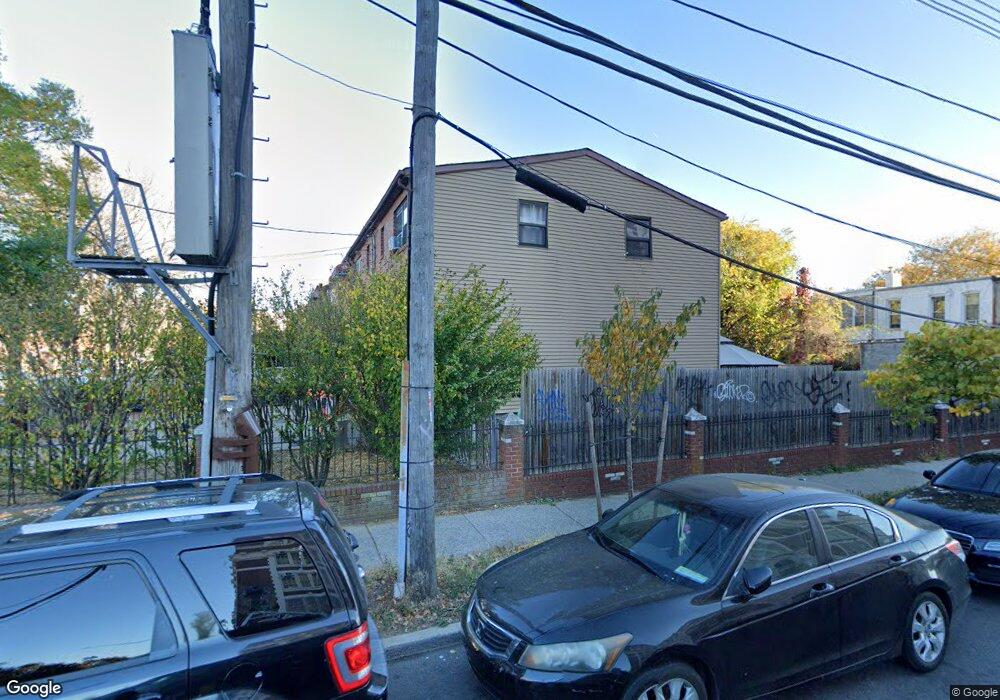
403 Vermont St Brooklyn, NY 11207
East New York NeighborhoodEstimated Value: $550,632 - $621,000
--
Bed
--
Bath
1,134
Sq Ft
$523/Sq Ft
Est. Value
About This Home
This home is located at 403 Vermont St, Brooklyn, NY 11207 and is currently estimated at $592,658, approximately $522 per square foot. 403 Vermont St is a home located in Kings County with nearby schools including P.S. 149 Danny Kaye, J.H.S 292 Margaret S. Douglas, and Hyde Leadership Charter School-Brooklyn.
Ownership History
Date
Name
Owned For
Owner Type
Purchase Details
Closed on
Sep 6, 2013
Sold by
Ng Chen and Ng Jenny Chen
Bought by
Ng Chen and Ng Susan
Current Estimated Value
Purchase Details
Closed on
Apr 4, 1991
Sold by
East Bk Church Sponcomm
Bought by
Morgan Dawn and Morgan Phillip
Purchase Details
Closed on
Dec 20, 1990
Sold by
East Bklyn Ch Spons/Comm
Bought by
Edwards Amy and Edwards Randolph A
Create a Home Valuation Report for This Property
The Home Valuation Report is an in-depth analysis detailing your home's value as well as a comparison with similar homes in the area
Home Values in the Area
Average Home Value in this Area
Purchase History
| Date | Buyer | Sale Price | Title Company |
|---|---|---|---|
| Ng Chen | -- | -- | |
| Morgan Dawn | -- | -- | |
| Edwards Amy | -- | -- |
Source: Public Records
Tax History Compared to Growth
Tax History
| Year | Tax Paid | Tax Assessment Tax Assessment Total Assessment is a certain percentage of the fair market value that is determined by local assessors to be the total taxable value of land and additions on the property. | Land | Improvement |
|---|---|---|---|---|
| 2025 | $4,713 | $35,580 | $14,820 | $20,760 |
| 2024 | $4,713 | $34,560 | $14,820 | $19,740 |
| 2023 | $4,446 | $36,420 | $14,820 | $21,600 |
| 2022 | $4,242 | $32,100 | $14,820 | $17,280 |
| 2021 | $4,396 | $24,780 | $14,820 | $9,960 |
| 2020 | $4,387 | $26,160 | $14,820 | $11,340 |
| 2019 | $4,091 | $26,160 | $14,820 | $11,340 |
| 2018 | $3,761 | $18,448 | $11,714 | $6,734 |
| 2017 | $3,548 | $17,406 | $10,285 | $7,121 |
| 2016 | $3,480 | $17,406 | $11,526 | $5,880 |
| 2015 | $1,609 | $17,272 | $9,994 | $7,278 |
| 2014 | $1,609 | $16,296 | $10,235 | $6,061 |
Source: Public Records
Map
Nearby Homes
- 342 Wyona St
- 667 Sutter Ave
- 663 Sutter Ave
- 459 Belmont Ave
- 439 Vermont St
- 440 Miller Ave
- 412 Bradford St
- 317 Pennsylvania Ave
- 297 Pennsylvania Ave
- 443 Miller Ave
- 444 New Jersey Ave
- 353 Pennsylvania Ave
- 358 van Siclen Ave
- 34&36 Marginal St
- 402 van Siclen Ave
- 346 van Siclen Ave
- 477 Vermont St
- 486 Vermont St
- 2210 Pitkin Ave
- 419 van Siclen Ave