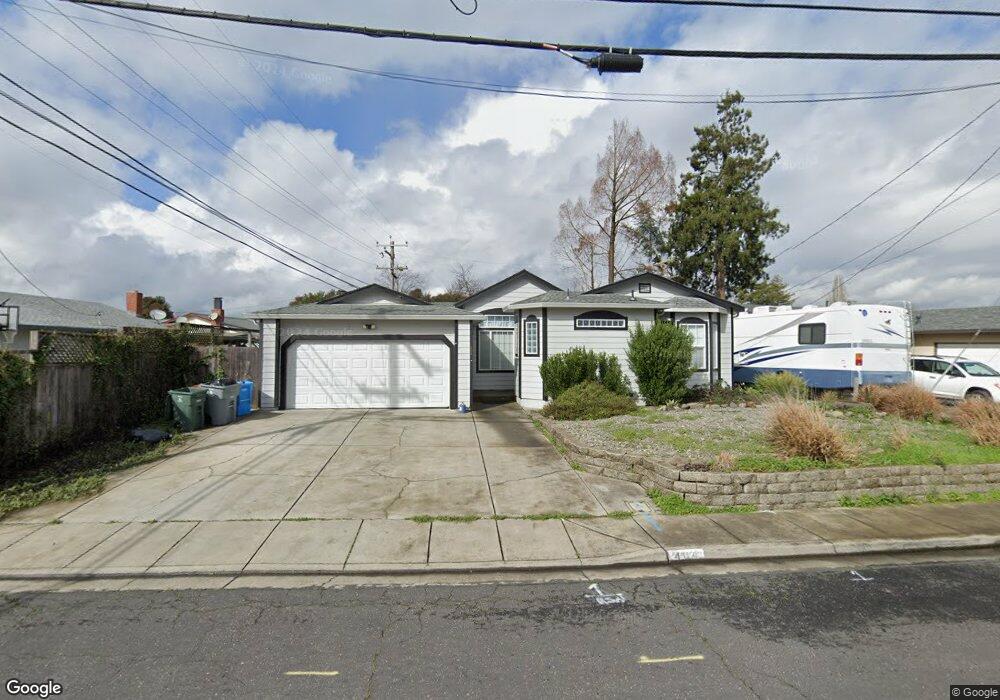
404 Anson Ave Rohnert Park, CA 94928
Estimated Value: $552,244 - $642,000
3
Beds
2
Baths
1,100
Sq Ft
$546/Sq Ft
Est. Value
About This Home
This home is located at 404 Anson Ave, Rohnert Park, CA 94928 and is currently estimated at $600,561, approximately $545 per square foot. 404 Anson Ave is a home located in Sonoma County with nearby schools including Rancho Cotate High School, Cross & Crown Lutheran School, and Bridghaven.
Ownership History
Date
Name
Owned For
Owner Type
Purchase Details
Closed on
Aug 27, 2013
Sold by
Hallen Michael Stephen and Hallen Connie C
Bought by
Hallen Michael S and Hallen Connie C
Current Estimated Value
Purchase Details
Closed on
Jan 22, 2013
Sold by
Hallen Michael Stephen and Hallen Connie C
Bought by
Hallen Michael Stephen and Hallen Connie C
Home Financials for this Owner
Home Financials are based on the most recent Mortgage that was taken out on this home.
Original Mortgage
$187,000
Outstanding Balance
$129,473
Interest Rate
3.28%
Mortgage Type
New Conventional
Estimated Equity
$471,088
Purchase Details
Closed on
Dec 29, 1999
Sold by
Hallen Steve and Hallen Connie C
Bought by
Hallen M Steven and Hallen Connie C
Home Financials for this Owner
Home Financials are based on the most recent Mortgage that was taken out on this home.
Original Mortgage
$100,000
Interest Rate
4.35%
Create a Home Valuation Report for This Property
The Home Valuation Report is an in-depth analysis detailing your home's value as well as a comparison with similar homes in the area
Home Values in the Area
Average Home Value in this Area
Purchase History
| Date | Buyer | Sale Price | Title Company |
|---|---|---|---|
| Hallen Michael S | -- | None Available | |
| Hallen Michael Stephen | -- | Fidelity National Title Co | |
| Hallen M Steven | -- | First American Title Co |
Source: Public Records
Mortgage History
| Date | Status | Borrower | Loan Amount |
|---|---|---|---|
| Open | Hallen Michael Stephen | $187,000 | |
| Closed | Hallen M Steven | $100,000 |
Source: Public Records
Tax History Compared to Growth
Tax History
| Year | Tax Paid | Tax Assessment Tax Assessment Total Assessment is a certain percentage of the fair market value that is determined by local assessors to be the total taxable value of land and additions on the property. | Land | Improvement |
|---|---|---|---|---|
| 2025 | $3,039 | $259,512 | $50,062 | $209,450 |
| 2024 | $3,039 | $254,425 | $49,081 | $205,344 |
| 2023 | $3,039 | $249,437 | $48,119 | $201,318 |
| 2022 | $2,979 | $244,547 | $47,176 | $197,371 |
| 2021 | $2,955 | $239,752 | $46,251 | $193,501 |
| 2020 | $2,997 | $237,294 | $45,777 | $191,517 |
| 2019 | $2,959 | $232,642 | $44,880 | $187,762 |
| 2018 | $2,903 | $228,081 | $44,000 | $184,081 |
| 2017 | $2,854 | $223,610 | $43,138 | $180,472 |
| 2016 | $2,734 | $219,227 | $42,293 | $176,934 |
| 2015 | $2,668 | $215,935 | $41,658 | $174,277 |
| 2014 | $2,649 | $211,706 | $40,842 | $170,864 |
Source: Public Records
Map
Nearby Homes
- 7449 Adrian Dr
- 219 College View Dr
- 229 Arlen Dr
- 950 Santa Alicia Dr
- 478 Santa Alicia Dr
- 530 Anson Ct
- 566 Santa Alicia Dr
- 7530 Bernice Ave
- 105 Nicholas Ct
- 101 Pinewood Ct
- 21 Avram Ave
- 746 Bernadette Ave
- 11 Avram Ave
- 368 Bonnie Ct
- 7301 Willlowglen Dr
- 7316 Willowglen Dr
- 359 Bonnie Ave
- 77 Walnut Cir
- 138 Walnut Cir
- 8034 Adrian Dr