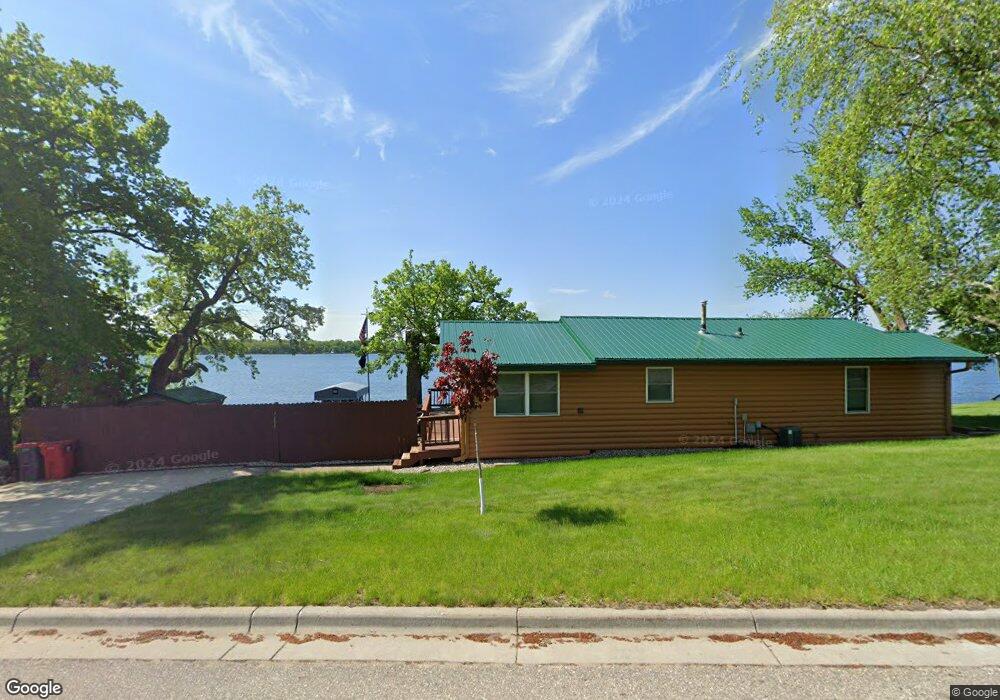
404 Carlos Darling Dr NW Alexandria, MN 56308
Estimated Value: $454,305 - $490,000
2
Beds
1
Bath
1,012
Sq Ft
$471/Sq Ft
Est. Value
About This Home
This home is located at 404 Carlos Darling Dr NW, Alexandria, MN 56308 and is currently estimated at $477,102, approximately $471 per square foot. 404 Carlos Darling Dr NW is a home located in Douglas County with nearby schools including Voyager Elementary School, Discovery Middle School, and Alexandria Area High School.
Ownership History
Date
Name
Owned For
Owner Type
Purchase Details
Closed on
Jul 31, 2020
Sold by
Segraves James P and Fancher Debra Renae
Bought by
Kurth Jamie R and Kurth Nicole L
Current Estimated Value
Home Financials for this Owner
Home Financials are based on the most recent Mortgage that was taken out on this home.
Original Mortgage
$264,000
Outstanding Balance
$234,619
Interest Rate
3.1%
Mortgage Type
New Conventional
Estimated Equity
$242,483
Purchase Details
Closed on
Sep 22, 2016
Sold by
Kloster Michael J and Kloster Judith A
Bought by
Segraves James P and Fancher Debra Renae
Purchase Details
Closed on
Jun 9, 2010
Sold by
Olson Troy A and Olson Erin N
Bought by
Kloster Michael J and Kloster Judith A
Create a Home Valuation Report for This Property
The Home Valuation Report is an in-depth analysis detailing your home's value as well as a comparison with similar homes in the area
Home Values in the Area
Average Home Value in this Area
Purchase History
| Date | Buyer | Sale Price | Title Company |
|---|---|---|---|
| Kurth Jamie R | $330,000 | Integrity Title Inc | |
| Segraves James P | -- | Integrity Title | |
| Kloster Michael J | $304,000 | None Available |
Source: Public Records
Mortgage History
| Date | Status | Borrower | Loan Amount |
|---|---|---|---|
| Open | Kurth Jamie R | $264,000 |
Source: Public Records
Tax History Compared to Growth
Tax History
| Year | Tax Paid | Tax Assessment Tax Assessment Total Assessment is a certain percentage of the fair market value that is determined by local assessors to be the total taxable value of land and additions on the property. | Land | Improvement |
|---|---|---|---|---|
| 2025 | $4,038 | $421,900 | $276,000 | $145,900 |
| 2024 | $4,038 | $404,600 | $264,000 | $140,600 |
| 2023 | $3,940 | $372,100 | $240,000 | $132,100 |
| 2022 | $3,598 | $348,700 | $228,000 | $120,700 |
| 2021 | $3,494 | $292,300 | $198,000 | $94,300 |
| 2020 | $2,922 | $275,500 | $192,000 | $83,500 |
| 2019 | $3,178 | $274,000 | $192,000 | $82,000 |
| 2018 | $3,058 | $290,500 | $209,300 | $81,200 |
| 2017 | $2,914 | $281,300 | $209,300 | $72,000 |
| 2016 | $3,098 | $271,115 | $203,021 | $68,094 |
| 2015 | $3,110 | $0 | $0 | $0 |
| 2014 | -- | $280,500 | $216,000 | $64,500 |
Source: Public Records
Map
Nearby Homes
- 105 Ross Garden NW
- 3307 N Nokomis NE
- 3006 N Nokomis NE
- 2606 Sessions St NW
- 3608 Tolena Rd NE
- 3877 Tolena Rd NE
- 7826 unit 6 County Road 42 NE
- 7826 unit 8 County Road 42 NE
- 7826 unit 9 County Road 42 NE
- 7826 unit 3 County Road 42 NE
- 7826 unit 7 County Road 42 NE
- 3311 N Nokomis NE
- 2600 Le Homme Dieu View NE
- 2807 Government Point Rd NE
- 205 Ashley Ln
- 4974 Interlachen Dr NE
- 151 Bluffs Rd NW
- 4715 Dixie Ln SW
- 1902 E Golf Course Rd NE Unit NE
- 682-688 Voyager Dr
- xxx County Road 11 NE
- 406 Carlos Darling Dr NW
- 408 Carlos Darling Dr NW
- 307 Carlos Darling Dr NE
- 3901 County Road 11 NE
- 305 Carlos Darling Dr NE
- 410 Carlos Darling Dr NW
- 410 Carlos Darling Dr NW
- 3931 County Road 11 NE
- 303 Carlos Darling Dr NE
- 3941 County Road 11 NE
- 504 Carlos Darling Ct NW
- 504 Carlos Darling Ct NW
- 504 Carlos Darling Ct NW
- XXX Carlos Darling Dr NW
- 506 Carlos Darling Ct NW
- 3953 County Road 11 NE
- 508 Carlos Darling Ct NW
- 510 Carlos Darling Ct NW
- 3815 Casa Marina Rd NW