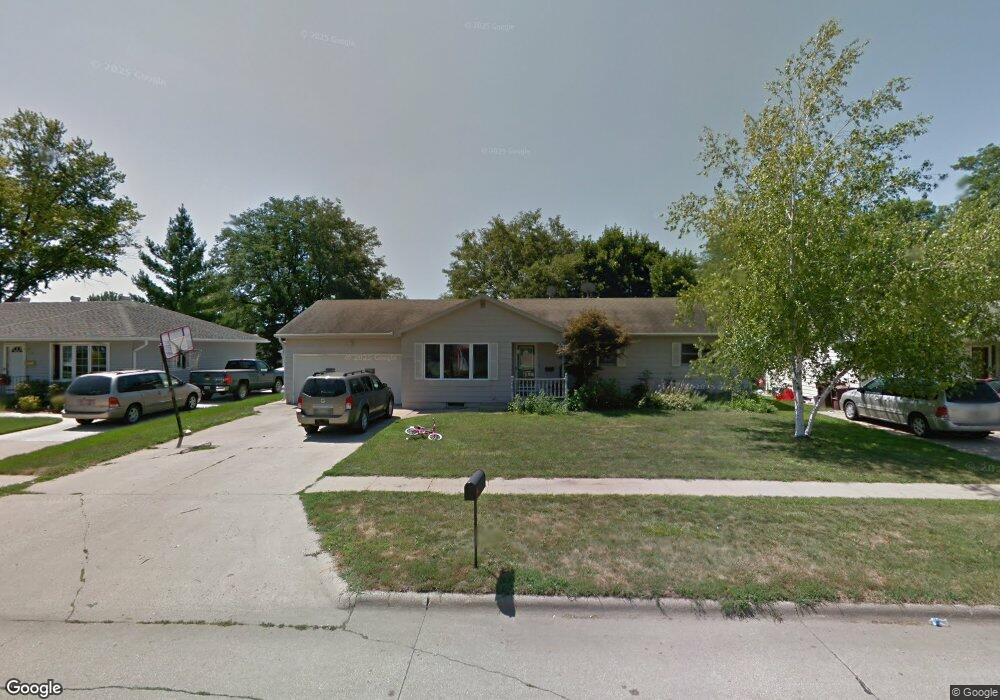
404 E 32nd St South Sioux City, NE 68776
Estimated Value: $265,000 - $305,000
3
Beds
1
Bath
1,642
Sq Ft
$174/Sq Ft
Est. Value
About This Home
This home is located at 404 E 32nd St, South Sioux City, NE 68776 and is currently estimated at $285,058, approximately $173 per square foot. 404 E 32nd St is a home located in Dakota County with nearby schools including Cardinal Elementary School, South Sioux City Middle School, and South Sioux Senior High School.
Ownership History
Date
Name
Owned For
Owner Type
Purchase Details
Closed on
May 19, 2005
Sold by
Vega Benjamin and Vega Rosalva
Bought by
Amaya Antonio and Larreynaga Nora
Current Estimated Value
Home Financials for this Owner
Home Financials are based on the most recent Mortgage that was taken out on this home.
Original Mortgage
$143,744
Outstanding Balance
$76,527
Interest Rate
5.87%
Mortgage Type
FHA
Estimated Equity
$208,531
Purchase Details
Closed on
Jul 10, 2004
Sold by
Meinen Roger W and Meinen Marjorie A
Bought by
Vega Benjamin and Vega Rosalva
Create a Home Valuation Report for This Property
The Home Valuation Report is an in-depth analysis detailing your home's value as well as a comparison with similar homes in the area
Home Values in the Area
Average Home Value in this Area
Purchase History
| Date | Buyer | Sale Price | Title Company |
|---|---|---|---|
| Amaya Antonio | $113,555 | -- | |
| Vega Benjamin | $140,000 | -- |
Source: Public Records
Mortgage History
| Date | Status | Borrower | Loan Amount |
|---|---|---|---|
| Closed | Larreynaga Nora | $38,250 | |
| Open | Amaya Antonio | $143,744 |
Source: Public Records
Tax History Compared to Growth
Tax History
| Year | Tax Paid | Tax Assessment Tax Assessment Total Assessment is a certain percentage of the fair market value that is determined by local assessors to be the total taxable value of land and additions on the property. | Land | Improvement |
|---|---|---|---|---|
| 2024 | $3,246 | $248,800 | $20,980 | $227,820 |
| 2023 | $3,961 | $223,055 | $17,900 | $205,155 |
| 2022 | $3,975 | $207,845 | $17,900 | $189,945 |
| 2021 | $3,777 | $190,575 | $17,900 | $172,675 |
| 2020 | $3,744 | $187,255 | $17,900 | $169,355 |
| 2019 | $3,509 | $174,985 | $17,900 | $157,085 |
| 2018 | $3,481 | $172,175 | $18,150 | $154,025 |
| 2017 | $3,020 | $149,740 | $18,150 | $131,590 |
| 2016 | $2,467 | $124,410 | $18,150 | $106,260 |
| 2014 | $2,882 | $139,975 | $19,125 | $120,850 |
Source: Public Records
Map
Nearby Homes