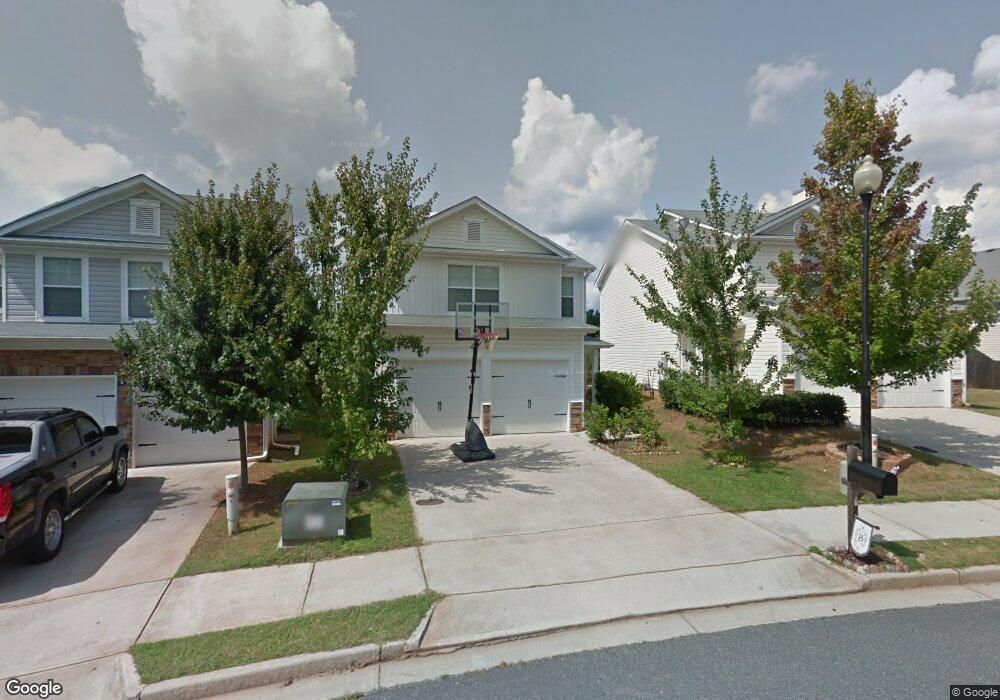
404 Hidden Creek Ct Canton, GA 30114
Estimated Value: $331,458 - $345,000
3
Beds
3
Baths
1,590
Sq Ft
$213/Sq Ft
Est. Value
About This Home
This home is located at 404 Hidden Creek Ct, Canton, GA 30114 and is currently estimated at $338,229, approximately $212 per square foot. 404 Hidden Creek Ct is a home located in Cherokee County with nearby schools including Liberty Elementary School, Freedom Middle School, and Cherokee High School.
Ownership History
Date
Name
Owned For
Owner Type
Purchase Details
Closed on
Aug 31, 2010
Sold by
Chandler Ricky and Chandler Michele
Bought by
Bennett Kyle T
Current Estimated Value
Home Financials for this Owner
Home Financials are based on the most recent Mortgage that was taken out on this home.
Original Mortgage
$99,558
Outstanding Balance
$64,585
Interest Rate
4.25%
Mortgage Type
FHA
Estimated Equity
$273,644
Purchase Details
Closed on
May 24, 2010
Sold by
Hud-Housing Of Urban Dev
Bought by
Chandler Ricky and Reece Greg
Home Financials for this Owner
Home Financials are based on the most recent Mortgage that was taken out on this home.
Original Mortgage
$92,400
Interest Rate
5.02%
Purchase Details
Closed on
Nov 3, 2009
Sold by
Bac Home Loans Servicing Lp
Bought by
Hud-Housing Of Urban Dev
Purchase Details
Closed on
Dec 28, 2007
Sold by
Legacy Communities Of Hidden C
Bought by
Smith Michael L
Home Financials for this Owner
Home Financials are based on the most recent Mortgage that was taken out on this home.
Original Mortgage
$153,748
Interest Rate
6.05%
Create a Home Valuation Report for This Property
The Home Valuation Report is an in-depth analysis detailing your home's value as well as a comparison with similar homes in the area
Home Values in the Area
Average Home Value in this Area
Purchase History
| Date | Buyer | Sale Price | Title Company |
|---|---|---|---|
| Bennett Kyle T | $100,900 | -- | |
| Chandler Ricky | -- | -- | |
| Hud-Housing Of Urban Dev | -- | -- | |
| Bac Home Loans Servicing | $161,663 | -- | |
| Smith Michael L | $155,000 | -- |
Source: Public Records
Mortgage History
| Date | Status | Borrower | Loan Amount |
|---|---|---|---|
| Open | Bennett Kyle T | $99,558 | |
| Previous Owner | Chandler Ricky | $92,400 | |
| Previous Owner | Smith Michael L | $153,748 |
Source: Public Records
Tax History Compared to Growth
Tax History
| Year | Tax Paid | Tax Assessment Tax Assessment Total Assessment is a certain percentage of the fair market value that is determined by local assessors to be the total taxable value of land and additions on the property. | Land | Improvement |
|---|---|---|---|---|
| 2025 | $2,918 | $118,788 | $30,000 | $88,788 |
| 2024 | $2,688 | $106,332 | $28,000 | $78,332 |
| 2023 | $2,389 | $114,072 | $26,000 | $88,072 |
| 2022 | $2,358 | $92,200 | $21,600 | $70,600 |
| 2021 | $2,119 | $76,760 | $17,200 | $59,560 |
| 2020 | $1,995 | $71,800 | $16,000 | $55,800 |
| 2019 | $1,735 | $61,480 | $14,000 | $47,480 |
| 2018 | $1,710 | $60,240 | $14,000 | $46,240 |
| 2017 | $1,597 | $138,500 | $12,000 | $43,400 |
| 2016 | $1,278 | $134,900 | $12,000 | $41,960 |
| 2015 | $1,195 | $123,300 | $9,600 | $39,720 |
| 2014 | $1,389 | $113,000 | $9,600 | $35,600 |
Source: Public Records
Map
Nearby Homes
- 220 Hidden Creek Point
- 116 Spring Way Square
- 168 Spring Way Square
- 230 Valley Crossing
- 922 Gardenia Curve
- 256 Valley Crossing
- 262 Valley Crossing
- 810 Ash St
- 265 Valley Crossing
- 288 Valley Crossing
- 808 Inkberry Rd
- 529 Poplar Bend
- 314 Valley Crossing
- 533 Poplar Bend
- 151 Nacoochee Way
- 137 Nacoochee Way
- 132 Nacoochee Way
- 406 Hidden Creek Ct
- 402 Hidden Creek Ct
- 408 Hidden Creek Ct
- 336 Hidden Creek Ln
- 338 Hidden Creek Ln
- 334 Hidden Creek Ln
- 344 Hidden Creek Ln
- 346 Hidden Creek Ln
- 332 Hidden Creek Ln
- 348 Hidden Creek Ln
- 0 Hidden Creek Ct Unit 7472211
- 0 Hidden Creek Ct Unit 7430633
- 0 Hidden Creek Ct Unit 7362319
- 0 Hidden Creek Ct Unit 8368739
- 0 Hidden Creek Ct Unit 8839280
- 0 Hidden Creek Ct Unit 8699336
- 410 Hidden Creek Ct
- 342 Hidden Creek Ln
- 330 Hidden Creek Ln
- 405 Hidden Creek Ct