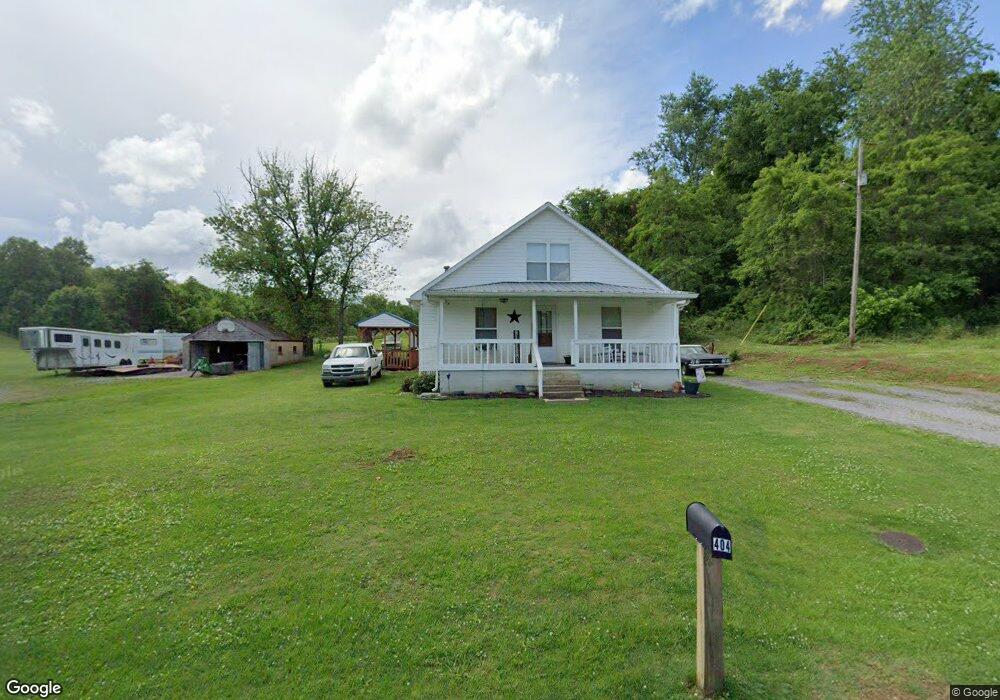
404 Warrensburg Rd Russellville, TN 37860
Estimated Value: $208,000 - $287,000
--
Bed
1
Bath
1,596
Sq Ft
$152/Sq Ft
Est. Value
About This Home
This home is located at 404 Warrensburg Rd, Russellville, TN 37860 and is currently estimated at $242,368, approximately $151 per square foot. 404 Warrensburg Rd is a home located in Hamblen County with nearby schools including Russellville Elementary School, East Ridge Middle School, and Morristown East High School.
Ownership History
Date
Name
Owned For
Owner Type
Purchase Details
Closed on
Aug 10, 2012
Sold by
Davidson Pauline O
Bought by
Hurley Charles C
Current Estimated Value
Home Financials for this Owner
Home Financials are based on the most recent Mortgage that was taken out on this home.
Original Mortgage
$97,206
Outstanding Balance
$65,995
Interest Rate
3.25%
Mortgage Type
FHA
Estimated Equity
$176,373
Purchase Details
Closed on
Oct 4, 2007
Sold by
Stephen Trapanese
Bought by
Davidson Pauline O
Purchase Details
Closed on
Feb 13, 2006
Sold by
Jarnigan Sam H
Bought by
Stephen Trapanese
Home Financials for this Owner
Home Financials are based on the most recent Mortgage that was taken out on this home.
Original Mortgage
$57,760
Interest Rate
6.08%
Purchase Details
Closed on
Aug 19, 1999
Bought by
Jarnigan Sam H and Jarnigan Linda F
Purchase Details
Closed on
Jun 22, 1998
Sold by
Howington Hobert H L E
Bought by
Jarnigan Sam
Purchase Details
Closed on
Aug 4, 1979
Bought by
Howington Hobart H L and Howington E
Create a Home Valuation Report for This Property
The Home Valuation Report is an in-depth analysis detailing your home's value as well as a comparison with similar homes in the area
Home Values in the Area
Average Home Value in this Area
Purchase History
| Date | Buyer | Sale Price | Title Company |
|---|---|---|---|
| Hurley Charles C | $99,000 | -- | |
| Davidson Pauline O | $90,000 | -- | |
| Stephen Trapanese | $72,200 | -- | |
| Jarnigan Sam H | $19,000 | -- | |
| Jarnigan Sam | $38,000 | -- | |
| Howington Hobart H L | -- | -- |
Source: Public Records
Mortgage History
| Date | Status | Borrower | Loan Amount |
|---|---|---|---|
| Open | Hurley Charles C | $97,206 | |
| Previous Owner | Howington Hobart H L | $57,760 |
Source: Public Records
Tax History Compared to Growth
Tax History
| Year | Tax Paid | Tax Assessment Tax Assessment Total Assessment is a certain percentage of the fair market value that is determined by local assessors to be the total taxable value of land and additions on the property. | Land | Improvement |
|---|---|---|---|---|
| 2024 | $433 | $22,000 | $2,525 | $19,475 |
| 2023 | $433 | $22,000 | $0 | $0 |
| 2022 | $433 | $22,000 | $2,525 | $19,475 |
| 2021 | $433 | $22,000 | $2,525 | $19,475 |
| 2020 | $433 | $22,000 | $2,525 | $19,475 |
| 2019 | $499 | $23,425 | $2,525 | $20,900 |
| 2018 | $499 | $23,425 | $2,525 | $20,900 |
| 2017 | $499 | $23,425 | $2,525 | $20,900 |
| 2016 | $466 | $23,425 | $2,525 | $20,900 |
| 2015 | $433 | $23,425 | $2,525 | $20,900 |
| 2014 | -- | $23,425 | $2,525 | $20,900 |
| 2013 | -- | $25,000 | $0 | $0 |
Source: Public Records
Map
Nearby Homes
- 5740 Dodson Ferry Rd
- 5790 N 2nd St
- 6284 Old Russellville Pike
- 6330 Old Russellville Pike
- 233 Harvey Dr
- 5751 Charlene Dr
- 6421 Old Russellville Pike
- 6563 E Andrew Johnson Hwy
- 00 Shinbone E Sugar Hollow Rd
- 6650 E Andrew Johnson Hwy
- 505 Mary St
- 814 Pullen Rd
- 770 Harvey Dr
- 354 Volunteer Dr
- 1290 Little Mountain Rd
- 1341 Little Mountain Rd
- Tract 3 Shinbone Rd
- Tract 4 Shinbone Rd
- 1976/1986 Shinbone Rd
- Tract 2 Shinbone Rd
- 438 Warrensburg Rd
- 451 Warrensburg Rd
- 353 Warrensburg Rd
- 303 Warrensburg Rd
- 562 Warrensburg Rd
- 5865 E Sugar Hollow Rd
- 5983 E Sugar Hollow Rd
- 785 Warrensburg Rd
- 805 Warrensburg Rd
- 5990 E Sugar Hollow Rd
- 5853 E Sugar Hollow Rd
- 804 Warrensburg Rd
- 197 Warrensburg Rd
- 4553 Fish Hatchery Rd
- 5849 E Sugar Hollow Rd
- 181 Warrensburg Rd
- 177 Warrensburg Rd
- 145 Warrensburg Rd
- 5782 E Andrew Johnson Hwy
- 879 Warrensburg Rd