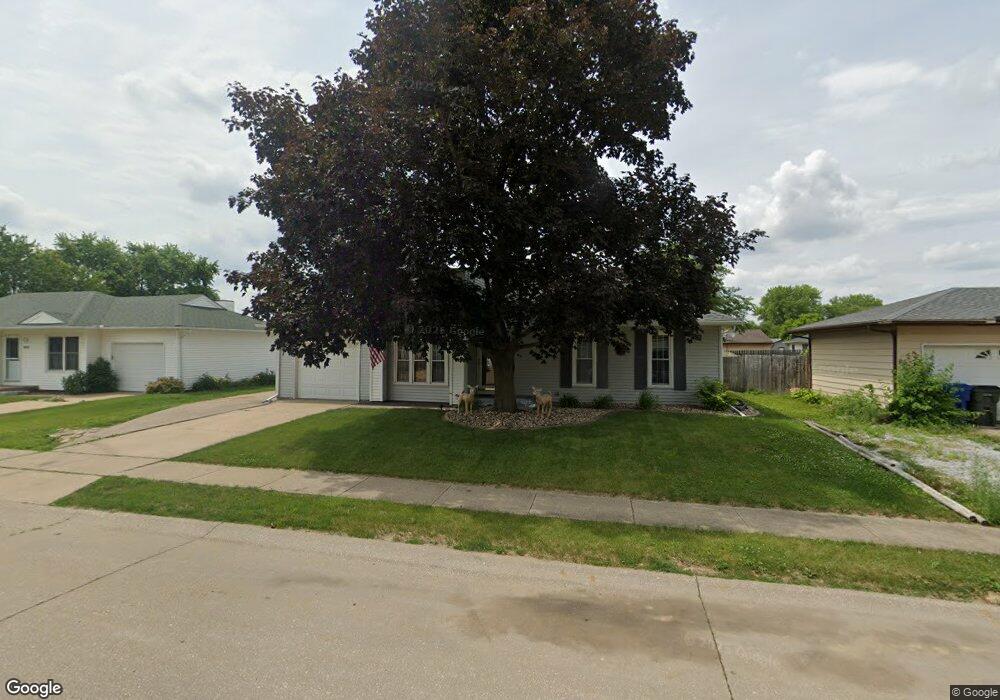
4040 Lamphere Ct Davenport, IA 52806
North Side NeighborhoodEstimated Value: $164,000 - $224,000
4
Beds
1
Bath
1,171
Sq Ft
$172/Sq Ft
Est. Value
About This Home
This home is located at 4040 Lamphere Ct, Davenport, IA 52806 and is currently estimated at $201,666, approximately $172 per square foot. 4040 Lamphere Ct is a home located in Scott County with nearby schools including Tygart Creek Elementary School, Buchanan Elementary School, and Christian County Day Treatment Center Alt.
Ownership History
Date
Name
Owned For
Owner Type
Purchase Details
Closed on
Aug 8, 2011
Sold by
Dipple Dennis E and Dipple Rebecca K
Bought by
Ortiz Mario Garcia
Current Estimated Value
Home Financials for this Owner
Home Financials are based on the most recent Mortgage that was taken out on this home.
Original Mortgage
$125,729
Outstanding Balance
$86,824
Interest Rate
4.59%
Mortgage Type
FHA
Estimated Equity
$114,842
Create a Home Valuation Report for This Property
The Home Valuation Report is an in-depth analysis detailing your home's value as well as a comparison with similar homes in the area
Home Values in the Area
Average Home Value in this Area
Purchase History
| Date | Buyer | Sale Price | Title Company |
|---|---|---|---|
| Ortiz Mario Garcia | $129,125 | None Available |
Source: Public Records
Mortgage History
| Date | Status | Borrower | Loan Amount |
|---|---|---|---|
| Open | Ortiz Mario Garcia | $125,729 |
Source: Public Records
Tax History Compared to Growth
Tax History
| Year | Tax Paid | Tax Assessment Tax Assessment Total Assessment is a certain percentage of the fair market value that is determined by local assessors to be the total taxable value of land and additions on the property. | Land | Improvement |
|---|---|---|---|---|
| 2025 | $4,349 | $222,940 | $26,480 | $196,460 |
| 2024 | $4,436 | $198,980 | $26,480 | $172,500 |
| 2023 | $4,860 | $191,880 | $26,480 | $165,400 |
| 2022 | $4,308 | $172,760 | $21,810 | $150,950 |
| 2021 | $3,708 | $172,760 | $21,810 | $150,950 |
| 2020 | $4,521 | $172,760 | $21,810 | $150,950 |
| 2019 | $4,112 | $159,040 | $21,810 | $137,230 |
| 2018 | $1,394 | $159,040 | $21,810 | $137,230 |
| 2017 | $3,460 | $152,180 | $21,810 | $130,370 |
| 2016 | $3,901 | $152,180 | $0 | $0 |
| 2015 | $3,332 | $131,520 | $0 | $0 |
| 2014 | $2,920 | $131,520 | $0 | $0 |
| 2013 | $2,870 | $0 | $0 | $0 |
| 2012 | -- | $124,300 | $19,510 | $104,790 |
Source: Public Records
Map
Nearby Homes
- 3932 N Elsie Ave
- 4036 Hillandale Rd
- 3325 Covington Dr
- 4325 N Michigan Ave
- 4413 N Michigan Ave
- 4425 N Michigan Ave
- 2728 W 38th Place
- 2724 W 38th Place
- 3208 W 47th Place
- 3812 N Thornwood Ave
- 3112 W 34th St
- 3705 W 46th St
- 3117 W 34th St
- 3313 W 48th Place
- 4504 N Gayman Ave
- 4849 Oakwood Ct
- 2307 W 38th Place
- 4406 Regency Place
- 3536 Heatherton Dr
- 2223 W 34th St
- 4046 Lamphere Ct
- 4032 Lamphere Ct
- 4011 Bedford Place
- 4019 Bedford Place
- 4005 Bedford Place
- 4052 Lamphere Ct
- 4026 Lamphere Ct
- 4025 Bedford Place
- 4039 Lamphere Ct
- 3117 Covington Dr
- 4031 Lamphere Ct
- 4003 Bedford Place
- 4029 Bedford Place
- 4106 Lamphere Ct
- 4020 Lamphere Ct
- 4025 Lamphere Ct
- 3110 W 43rd St
- 4035 Bedford Place
- 4001 Bedford Place
- 3118 Covington Dr