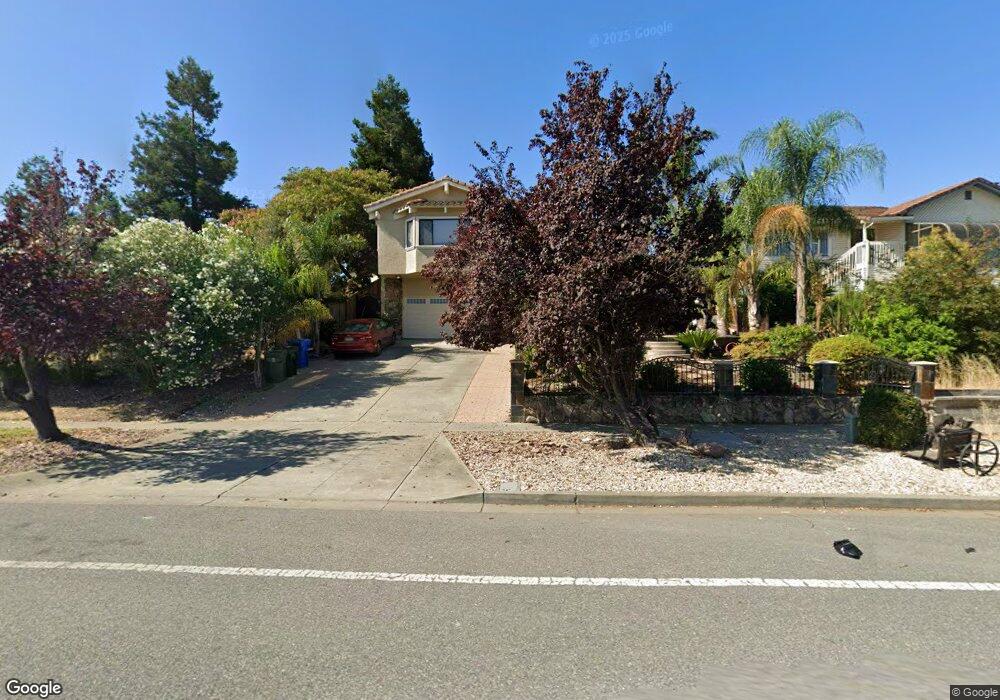
40449 Paseo Padre Pkwy Fremont, CA 94538
Downtown Fremont NeighborhoodEstimated Value: $1,315,000 - $1,718,217
3
Beds
2
Baths
2,294
Sq Ft
$686/Sq Ft
Est. Value
About This Home
This home is located at 40449 Paseo Padre Pkwy, Fremont, CA 94538 and is currently estimated at $1,574,554, approximately $686 per square foot. 40449 Paseo Padre Pkwy is a home located in Alameda County with nearby schools including J. Haley Durham Elementary School, G.M. Walters Middle School, and John F. Kennedy High School.
Ownership History
Date
Name
Owned For
Owner Type
Purchase Details
Closed on
Dec 12, 2012
Sold by
Tran Lexuan
Bought by
Pjl Properties Llc
Current Estimated Value
Purchase Details
Closed on
Nov 15, 2012
Sold by
Troop Thomas
Bought by
Tran Lexuan
Purchase Details
Closed on
Jun 27, 2005
Sold by
Troop Nadra
Bought by
Troop Thomas
Home Financials for this Owner
Home Financials are based on the most recent Mortgage that was taken out on this home.
Original Mortgage
$624,000
Interest Rate
1%
Mortgage Type
Negative Amortization
Purchase Details
Closed on
Dec 7, 2004
Sold by
Bodine Jack O and Bodine Susan
Bought by
Mojaddedi Mohammed and Mojaddedi Asma
Home Financials for this Owner
Home Financials are based on the most recent Mortgage that was taken out on this home.
Original Mortgage
$487,500
Interest Rate
5.7%
Mortgage Type
Stand Alone First
Create a Home Valuation Report for This Property
The Home Valuation Report is an in-depth analysis detailing your home's value as well as a comparison with similar homes in the area
Home Values in the Area
Average Home Value in this Area
Purchase History
| Date | Buyer | Sale Price | Title Company |
|---|---|---|---|
| Pjl Properties Llc | $485,000 | None Available | |
| Tran Lexuan | $485,000 | Old Republic Title Company | |
| Troop Thomas | -- | Old Republic Title Company | |
| Troop Thomas | -- | New Century Title Company | |
| Troop Thomas | $780,000 | New Century Title Company | |
| Mojaddedi Mohammed | $650,000 | Commonwealth Land Title |
Source: Public Records
Mortgage History
| Date | Status | Borrower | Loan Amount |
|---|---|---|---|
| Previous Owner | Troop Thomas | $624,000 | |
| Previous Owner | Troop Thomas | $78,000 | |
| Previous Owner | Mojaddedi Mohammed | $487,500 |
Source: Public Records
Tax History Compared to Growth
Tax History
| Year | Tax Paid | Tax Assessment Tax Assessment Total Assessment is a certain percentage of the fair market value that is determined by local assessors to be the total taxable value of land and additions on the property. | Land | Improvement |
|---|---|---|---|---|
| 2025 | $7,459 | $597,218 | $179,165 | $418,053 |
| 2024 | $7,459 | $585,510 | $175,653 | $409,857 |
| 2023 | $7,254 | $574,031 | $172,209 | $401,822 |
| 2022 | $7,151 | $562,778 | $168,833 | $393,945 |
| 2021 | $6,979 | $551,744 | $165,523 | $386,221 |
| 2020 | $6,969 | $546,090 | $163,827 | $382,263 |
| 2019 | $6,892 | $535,385 | $160,615 | $374,770 |
| 2018 | $6,757 | $524,890 | $157,467 | $367,423 |
| 2017 | $6,589 | $514,598 | $154,379 | $360,219 |
| 2016 | $6,473 | $504,511 | $151,353 | $353,158 |
| 2015 | $6,384 | $496,935 | $149,080 | $347,855 |
| 2014 | $6,271 | $487,201 | $146,160 | $341,041 |
Source: Public Records
Map
Nearby Homes
- 40469 Shaw Ct
- 40425 Chapel Way Unit 214
- 40425 Chapel Way Unit 309
- 40769 Squill Common
- 3848 Detjen St
- 40708 Fremont Blvd
- 3331 Union St
- 3695 Stevenson Blvd Unit E206
- 2851 Finca Terrace
- 3909 Stevenson Blvd Unit 402
- 39993 Fremont Blvd Unit 102
- 41043 Joyce Ave
- 4310 Providence Terrace
- 41082 Joyce Ave
- 40702 Greystone Terrace Unit 9
- 1962 Briscoe Terrace
- 4214 Providence Terrace
- 3518 Madison Common
- 3583 Madison Common
- 3454 Dayton Common
- 40429 Paseo Padre Pkwy
- 3011 Rockett Dr
- 40399 Paseo Padre Pkwy
- 3040 Cadman Rd
- 3030 Cadman Rd
- 40359 Paseo Padre Pkwy
- 3015 Rockett Dr
- 40396 Canoga St
- 3046 Cadman Rd
- 40329 Paseo Padre Pkwy
- 40364 Canoga St
- 3035 Rockett Dr
- 3004 Rockett Dr
- 3058 Cadman Rd
- 3018 Rockett Dr
- 3000 Baylis St
- 2800 Baylis St
- 40472 Shaw Ct
- 3026 Rockett Dr
- 3016 Baylis St