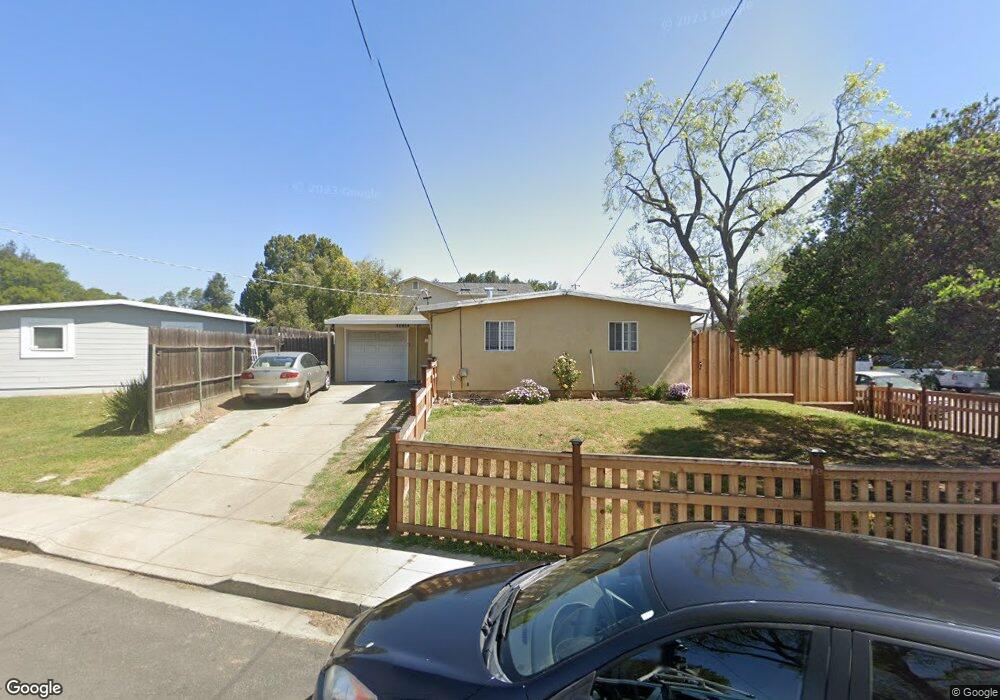
40484 Shaw Ct Fremont, CA 94538
Downtown Fremont NeighborhoodEstimated Value: $1,048,000 - $1,193,000
3
Beds
1
Bath
950
Sq Ft
$1,167/Sq Ft
Est. Value
About This Home
This home is located at 40484 Shaw Ct, Fremont, CA 94538 and is currently estimated at $1,108,289, approximately $1,166 per square foot. 40484 Shaw Ct is a home located in Alameda County with nearby schools including J. Haley Durham Elementary School, G.M. Walters Middle School, and John F. Kennedy High School.
Ownership History
Date
Name
Owned For
Owner Type
Purchase Details
Closed on
Mar 2, 2009
Sold by
Wells Fargo Bank Na
Bought by
Reclusado Gabriel E and Rubio Michelle M
Current Estimated Value
Home Financials for this Owner
Home Financials are based on the most recent Mortgage that was taken out on this home.
Original Mortgage
$293,842
Outstanding Balance
$185,950
Interest Rate
5.04%
Mortgage Type
Seller Take Back
Estimated Equity
$922,339
Purchase Details
Closed on
Feb 1, 2008
Sold by
Gonzalez Lorena P
Bought by
Wells Fargo Bank N A and Mlmi Trust
Purchase Details
Closed on
Sep 2, 2005
Sold by
Banuelos Rafael
Bought by
Gonzalez Lorena P
Home Financials for this Owner
Home Financials are based on the most recent Mortgage that was taken out on this home.
Original Mortgage
$99,000
Interest Rate
5.32%
Mortgage Type
Stand Alone Second
Create a Home Valuation Report for This Property
The Home Valuation Report is an in-depth analysis detailing your home's value as well as a comparison with similar homes in the area
Home Values in the Area
Average Home Value in this Area
Purchase History
| Date | Buyer | Sale Price | Title Company |
|---|---|---|---|
| Reclusado Gabriel E | $300,000 | Lsi Title Agency | |
| Wells Fargo Bank N A | $310,200 | None Available | |
| Gonzalez Lorena P | $495,000 | Chicago Title Co | |
| Gonzalez Lorena P | -- | Chicago Title Co |
Source: Public Records
Mortgage History
| Date | Status | Borrower | Loan Amount |
|---|---|---|---|
| Open | Reclusado Gabriel E | $293,842 | |
| Previous Owner | Gonzalez Lorena P | $99,000 | |
| Previous Owner | Gonzalez Lorena P | $396,000 |
Source: Public Records
Tax History Compared to Growth
Tax History
| Year | Tax Paid | Tax Assessment Tax Assessment Total Assessment is a certain percentage of the fair market value that is determined by local assessors to be the total taxable value of land and additions on the property. | Land | Improvement |
|---|---|---|---|---|
| 2025 | $5,117 | $386,300 | $115,890 | $270,410 |
| 2024 | $5,117 | $378,728 | $113,618 | $265,110 |
| 2023 | $4,969 | $371,303 | $111,391 | $259,912 |
| 2022 | $4,888 | $364,025 | $109,207 | $254,818 |
| 2021 | $4,773 | $356,888 | $107,066 | $249,822 |
| 2020 | $4,730 | $353,231 | $105,969 | $247,262 |
| 2019 | $4,680 | $346,307 | $103,892 | $242,415 |
| 2018 | $4,587 | $339,518 | $101,855 | $237,663 |
| 2017 | $4,474 | $332,861 | $99,858 | $233,003 |
| 2016 | $4,389 | $326,336 | $97,901 | $228,435 |
| 2015 | $4,323 | $321,437 | $96,431 | $225,006 |
| 2014 | $4,243 | $315,143 | $94,543 | $220,600 |
Source: Public Records
Map
Nearby Homes
- 40469 Shaw Ct
- 40425 Chapel Way Unit 214
- 40425 Chapel Way Unit 309
- 3848 Detjen St
- 40769 Squill Common
- 40708 Fremont Blvd
- 3331 Union St
- 3695 Stevenson Blvd Unit E206
- 3909 Stevenson Blvd Unit 402
- 39993 Fremont Blvd Unit 102
- 2851 Finca Terrace
- 4310 Providence Terrace
- 40702 Greystone Terrace Unit 9
- 4214 Providence Terrace
- 41043 Joyce Ave
- 3518 Madison Common
- 3583 Madison Common
- 41082 Joyce Ave
- 1962 Briscoe Terrace
- 3454 Dayton Common
- 40472 Shaw Ct
- 3035 Rockett Dr
- 40460 Shaw Ct
- 3062 Rockett Dr
- 3044 Rockett Dr
- 3080 Rockett Dr
- 3015 Rockett Dr
- 40481 Shaw Ct
- 3026 Rockett Dr
- 3138 Rockett Dr
- 40457 Shaw Ct
- 3058 Cadman Rd
- 3066 Cadman Rd
- 3046 Cadman Rd
- 3156 Rockett Dr
- 3080 Cadman Rd
- 3018 Rockett Dr
- 3235 Rockett Dr
- 3142 Cadman Rd
- 3040 Cadman Rd