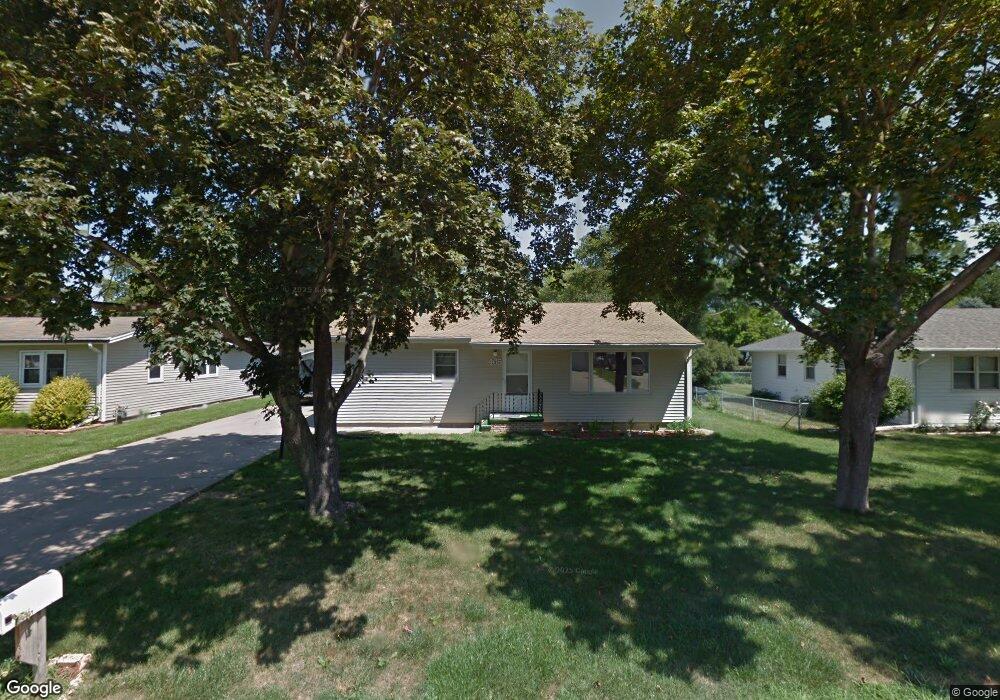
405 E 32nd St South Sioux City, NE 68776
Estimated Value: $219,418 - $227,000
3
Beds
1
Bath
1,260
Sq Ft
$177/Sq Ft
Est. Value
About This Home
This home is located at 405 E 32nd St, South Sioux City, NE 68776 and is currently estimated at $223,605, approximately $177 per square foot. 405 E 32nd St is a home located in Dakota County with nearby schools including Cardinal Elementary School, South Sioux City Middle School, and South Sioux Senior High School.
Ownership History
Date
Name
Owned For
Owner Type
Purchase Details
Closed on
Dec 15, 2014
Sold by
Reo Asset Management Company Llc
Bought by
Hbi Llc
Current Estimated Value
Purchase Details
Closed on
Nov 19, 2014
Sold by
Moreno Mayra
Bought by
Reo Asset Management Company Llc
Purchase Details
Closed on
May 9, 2006
Sold by
Becker Martin Allen
Bought by
Moreno Mayra
Home Financials for this Owner
Home Financials are based on the most recent Mortgage that was taken out on this home.
Original Mortgage
$67,600
Interest Rate
9.1%
Mortgage Type
Adjustable Rate Mortgage/ARM
Create a Home Valuation Report for This Property
The Home Valuation Report is an in-depth analysis detailing your home's value as well as a comparison with similar homes in the area
Home Values in the Area
Average Home Value in this Area
Purchase History
| Date | Buyer | Sale Price | Title Company |
|---|---|---|---|
| Hbi Llc | $98,000 | None Available | |
| Reo Asset Management Company Llc | $69,691 | None Available | |
| Moreno Mayra | $85,000 | -- |
Source: Public Records
Mortgage History
| Date | Status | Borrower | Loan Amount |
|---|---|---|---|
| Previous Owner | Moreno Mayra | $67,600 |
Source: Public Records
Tax History Compared to Growth
Tax History
| Year | Tax Paid | Tax Assessment Tax Assessment Total Assessment is a certain percentage of the fair market value that is determined by local assessors to be the total taxable value of land and additions on the property. | Land | Improvement |
|---|---|---|---|---|
| 2024 | $2,219 | $170,810 | $21,940 | $148,870 |
| 2023 | $2,781 | $156,605 | $18,535 | $138,070 |
| 2022 | $2,485 | $129,960 | $18,535 | $111,425 |
| 2021 | $2,375 | $119,830 | $18,535 | $101,295 |
| 2020 | $2,357 | $117,915 | $18,535 | $99,380 |
| 2019 | $2,364 | $117,915 | $18,535 | $99,380 |
| 2018 | $2,358 | $116,655 | $20,700 | $95,955 |
| 2017 | $2,102 | $104,225 | $20,700 | $83,525 |
| 2016 | $1,939 | $97,800 | $20,700 | $77,100 |
| 2014 | $2,035 | $98,850 | $19,125 | $79,725 |
Source: Public Records
Map
Nearby Homes