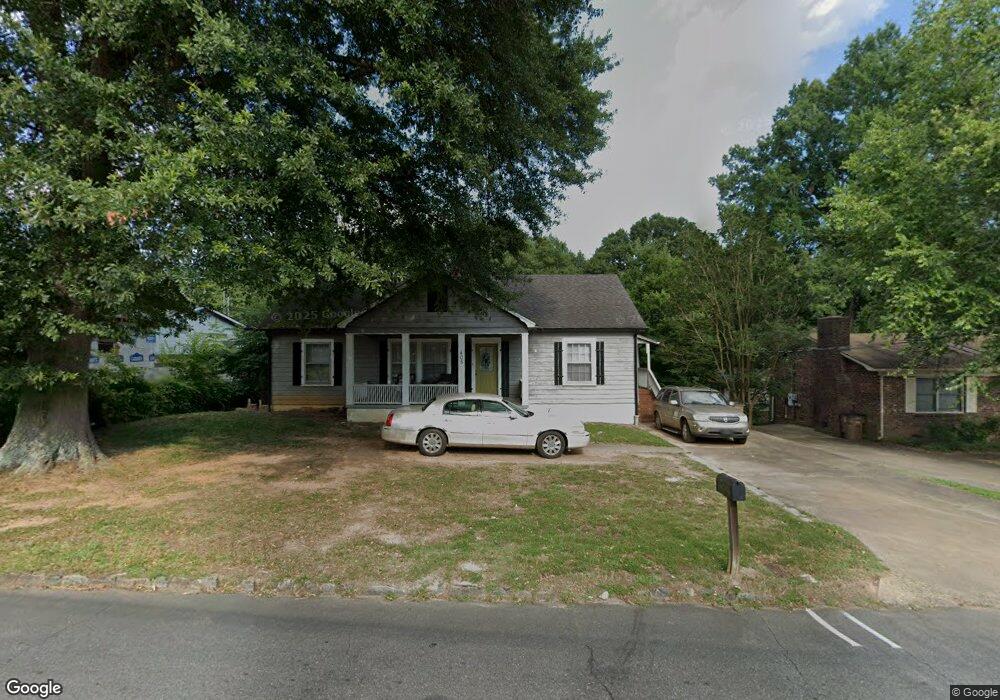
405 Gold St Shelby, NC 28150
Estimated Value: $184,273 - $264,000
4
Beds
2
Baths
1,610
Sq Ft
$145/Sq Ft
Est. Value
About This Home
This home is located at 405 Gold St, Shelby, NC 28150 and is currently estimated at $233,318, approximately $144 per square foot. 405 Gold St is a home located in Cleveland County with nearby schools including Graham Elementary School, Shelby Middle School, and Shelby High School.
Ownership History
Date
Name
Owned For
Owner Type
Purchase Details
Closed on
Mar 17, 2015
Sold by
Lovelace Mark David and Lovelace Ashley D
Bought by
Mcmillian Orr Angela
Current Estimated Value
Purchase Details
Closed on
Jun 28, 2006
Sold by
Countrywide Home Loans Inc
Bought by
Lovelace Mark David
Purchase Details
Closed on
Dec 6, 2005
Sold by
Brock & Scott Pllc
Bought by
Countrywide Home Loans Inc
Create a Home Valuation Report for This Property
The Home Valuation Report is an in-depth analysis detailing your home's value as well as a comparison with similar homes in the area
Home Values in the Area
Average Home Value in this Area
Purchase History
| Date | Buyer | Sale Price | Title Company |
|---|---|---|---|
| Mcmillian Orr Angela | $33,000 | None Available | |
| Lovelace Mark David | $48,500 | None Available | |
| Countrywide Home Loans Inc | $64,000 | None Available |
Source: Public Records
Tax History Compared to Growth
Tax History
| Year | Tax Paid | Tax Assessment Tax Assessment Total Assessment is a certain percentage of the fair market value that is determined by local assessors to be the total taxable value of land and additions on the property. | Land | Improvement |
|---|---|---|---|---|
| 2025 | $1,441 | $144,832 | $11,340 | $133,492 |
| 2024 | $766 | $61,491 | $9,315 | $52,176 |
| 2023 | $766 | $61,491 | $9,315 | $52,176 |
| 2022 | $762 | $61,491 | $9,315 | $52,176 |
| 2021 | $766 | $61,491 | $9,315 | $52,176 |
| 2020 | $935 | $73,481 | $9,315 | $64,166 |
| 2019 | $935 | $73,481 | $9,315 | $64,166 |
| 2018 | $934 | $73,481 | $9,315 | $64,166 |
| 2017 | $911 | $73,481 | $9,315 | $64,166 |
| 2016 | $913 | $73,481 | $9,315 | $64,166 |
| 2015 | $983 | $83,517 | $9,315 | $74,202 |
| 2014 | $983 | $83,517 | $9,315 | $74,202 |
Source: Public Records
Map
Nearby Homes