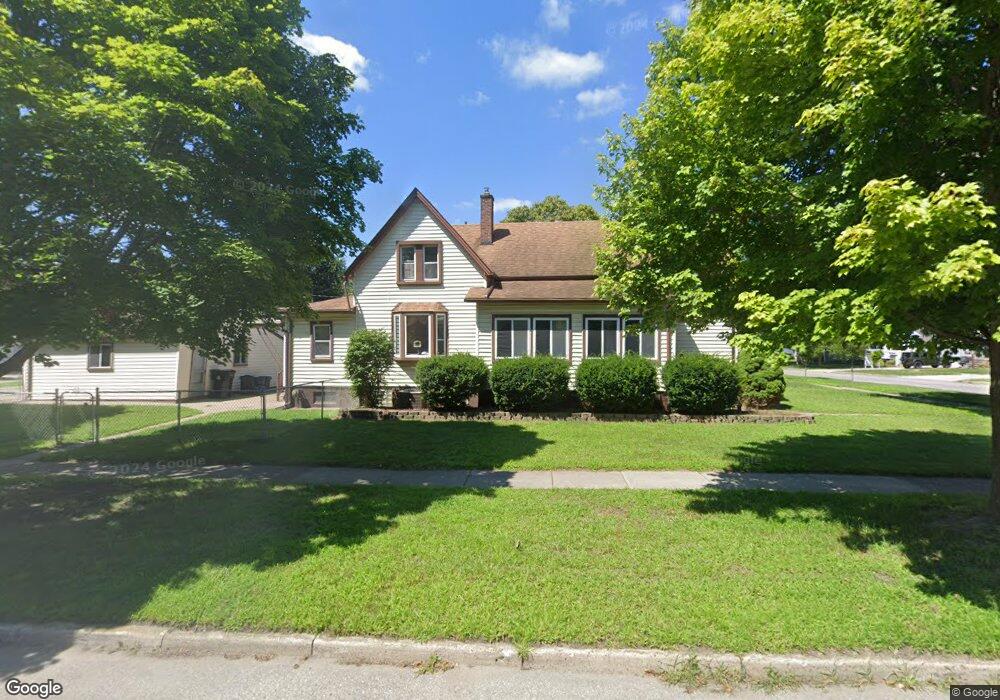
405 Orange St Wyandotte, MI 48192
Estimated Value: $185,963 - $273,000
--
Bed
--
Bath
1,349
Sq Ft
$169/Sq Ft
Est. Value
About This Home
This home is located at 405 Orange St, Wyandotte, MI 48192 and is currently estimated at $228,491, approximately $169 per square foot. 405 Orange St is a home located in Wayne County with nearby schools including Monroe Elementary School, Woodrow Wilson School, and Roosevelt High School.
Ownership History
Date
Name
Owned For
Owner Type
Purchase Details
Closed on
Jan 12, 2022
Sold by
Ross Austin J
Bought by
Ross Johnny T
Current Estimated Value
Purchase Details
Closed on
Jan 10, 2022
Sold by
Ross Johnny T
Bought by
Ross Austin J
Purchase Details
Closed on
Jan 27, 2014
Sold by
Brischke Joyce M
Bought by
Brischke Joyce M
Purchase Details
Closed on
Jun 12, 2009
Sold by
Brischke Joyce M and Brischke Ewald O
Bought by
Brischke Joyce M and The Ewald O & Joyce M Brischke Revocable
Create a Home Valuation Report for This Property
The Home Valuation Report is an in-depth analysis detailing your home's value as well as a comparison with similar homes in the area
Home Values in the Area
Average Home Value in this Area
Purchase History
| Date | Buyer | Sale Price | Title Company |
|---|---|---|---|
| Ross Johnny T | -- | Kevin M Gilhool Pc | |
| Ross Austin J | -- | None Listed On Document | |
| Brischke Joyce M | -- | None Available | |
| Brischke Joyce M | -- | None Available | |
| Brischke Joyce M | -- | None Available |
Source: Public Records
Tax History Compared to Growth
Tax History
| Year | Tax Paid | Tax Assessment Tax Assessment Total Assessment is a certain percentage of the fair market value that is determined by local assessors to be the total taxable value of land and additions on the property. | Land | Improvement |
|---|---|---|---|---|
| 2025 | $2,744 | $93,500 | $0 | $0 |
| 2024 | $2,744 | $89,800 | $0 | $0 |
| 2023 | $2,617 | $86,900 | $0 | $0 |
| 2022 | $3,363 | $84,200 | $0 | $0 |
| 2021 | $2,465 | $78,900 | $0 | $0 |
| 2020 | $2,431 | $65,900 | $0 | $0 |
| 2019 | $2,397 | $63,800 | $0 | $0 |
| 2018 | $1,913 | $49,800 | $0 | $0 |
| 2017 | $838 | $49,800 | $0 | $0 |
| 2016 | $2,315 | $44,500 | $0 | $0 |
| 2015 | $4,130 | $41,300 | $0 | $0 |
| 2013 | $3,780 | $37,800 | $0 | $0 |
| 2012 | $1,541 | $39,600 | $11,300 | $28,300 |
Source: Public Records
Map
Nearby Homes