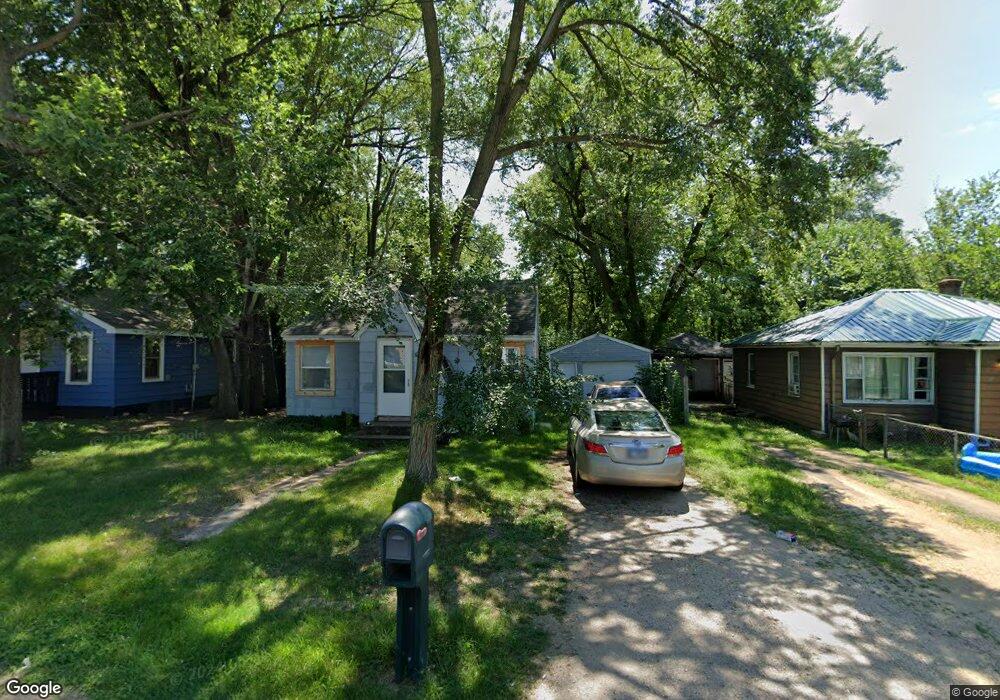
405 Sawyer Rd Rockford, IL 61109
Estimated Value: $61,826 - $85,000
1
Bed
1
Bath
534
Sq Ft
$132/Sq Ft
Est. Value
About This Home
This home is located at 405 Sawyer Rd, Rockford, IL 61109 and is currently estimated at $70,457, approximately $131 per square foot. 405 Sawyer Rd is a home located in Winnebago County with nearby schools including Riverdahl Elementary School, Rockford Environmental Science Academy, and Jefferson High School.
Ownership History
Date
Name
Owned For
Owner Type
Purchase Details
Closed on
Oct 2, 2023
Sold by
Sledge Elizabeth
Bought by
Sledge Eddie B
Current Estimated Value
Purchase Details
Closed on
Apr 16, 2021
Sold by
Winnebago County
Bought by
Sledge Elizabeth
Purchase Details
Closed on
Mar 23, 2021
Sold by
Cnty Clerk/Said Cnty/Winnebago
Bought by
Winnebago County
Purchase Details
Closed on
Aug 7, 2015
Sold by
Federal Natl Mtg Assn Fnma
Bought by
Flat Iron Holdings Llc
Purchase Details
Closed on
Aug 6, 2015
Sold by
Federal Natl Mtg Assn Fnma
Bought by
Flat Iron Holdings Llc
Create a Home Valuation Report for This Property
The Home Valuation Report is an in-depth analysis detailing your home's value as well as a comparison with similar homes in the area
Home Values in the Area
Average Home Value in this Area
Purchase History
| Date | Buyer | Sale Price | Title Company |
|---|---|---|---|
| Sledge Eddie B | -- | None Listed On Document | |
| Sledge Elizabeth | -- | Denzin Soltanzadeh Llc | |
| Winnebago County | -- | None Listed On Document | |
| Flat Iron Holdings Llc | -- | Attorney Only | |
| Flat Iron Holdings Llc | -- | Attorney Only |
Source: Public Records
Tax History Compared to Growth
Tax History
| Year | Tax Paid | Tax Assessment Tax Assessment Total Assessment is a certain percentage of the fair market value that is determined by local assessors to be the total taxable value of land and additions on the property. | Land | Improvement |
|---|---|---|---|---|
| 2024 | $647 | $12,831 | $1,192 | $11,639 |
| 2023 | $552 | $11,314 | $1,051 | $10,263 |
| 2022 | $1,155 | $10,112 | $939 | $9,173 |
| 2021 | $1,136 | $9,272 | $861 | $8,411 |
| 2020 | $1,127 | $8,765 | $814 | $7,951 |
| 2019 | $1,119 | $8,354 | $776 | $7,578 |
| 2018 | $1,197 | $8,362 | $731 | $7,631 |
| 2017 | $1,187 | $8,003 | $700 | $7,303 |
| 2016 | $1,186 | $7,853 | $687 | $7,166 |
| 2015 | $1,201 | $7,853 | $687 | $7,166 |
| 2014 | -- | $8,237 | $857 | $7,380 |
Source: Public Records
Map
Nearby Homes