
4051 W State Road 38 Sheridan, IN 46069
Estimated payment $7,281/month
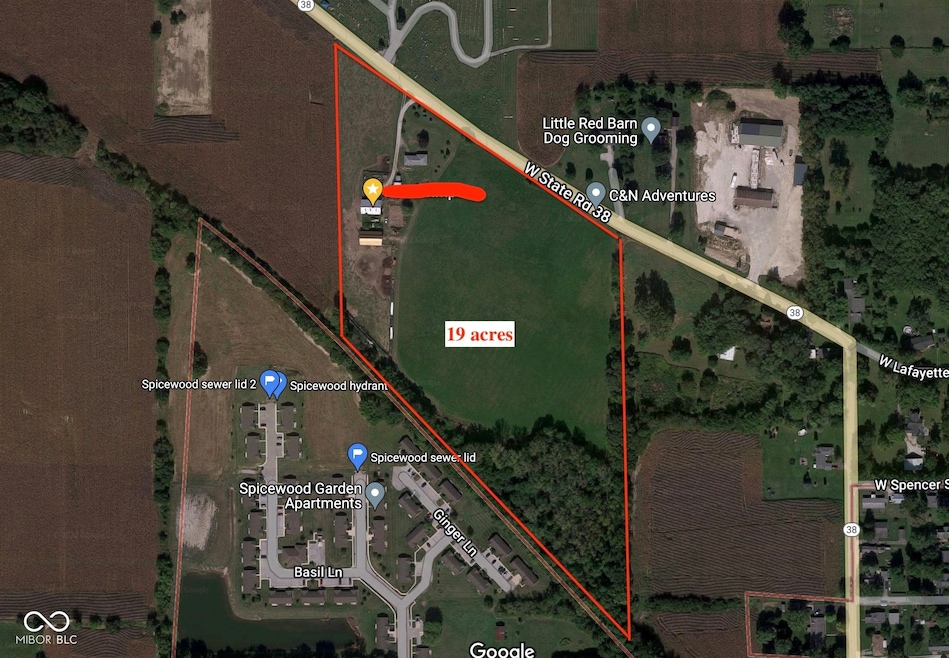
About This Lot
Property is on the Monon Trail extension in Sheridan. Seller may retain rights to structures. No building tours without an accepted contract.
Listing Agent
WKRP Indy Real Estate Brokerage Email: wkrpindy@gmail.com License #RB14033093 Listed on: 02/03/2025
Property Details
Property Type
- Land
Est. Annual Taxes
- $2,402
Schools
- Sheridan Elementary School
- Sheridan Middle School
- Sheridan High School
Additional Features
- 18.49 Acre Lot
- Municipal Utilities District Sewer
Listing and Financial Details
- Tax Lot 01-01-31-00-00-025.000
- Assessor Parcel Number 290131000025000001
Map
Home Values in the Area
Average Home Value in this Area
Tax History
| Year | Tax Paid | Tax Assessment Tax Assessment Total Assessment is a certain percentage of the fair market value that is determined by local assessors to be the total taxable value of land and additions on the property. | Land | Improvement |
|---|---|---|---|---|
| 2024 | $2,284 | $230,000 | $84,400 | $145,600 |
| 2023 | $2,401 | $216,000 | $78,700 | $137,300 |
| 2022 | $2,245 | $197,500 | $72,800 | $124,700 |
| 2021 | $2,044 | $181,700 | $69,600 | $112,100 |
| 2020 | $1,930 | $174,600 | $69,500 | $105,100 |
| 2019 | $1,869 | $169,600 | $54,800 | $114,800 |
| 2018 | $1,896 | $167,400 | $55,500 | $111,900 |
| 2017 | $1,873 | $164,800 | $58,900 | $105,900 |
| 2016 | $1,886 | $173,300 | $60,500 | $112,800 |
| 2014 | $1,481 | $145,400 | $60,300 | $85,100 |
| 2013 | $1,481 | $141,100 | $56,000 | $85,100 |
Property History
| Date | Event | Price | List to Sale | Price per Sq Ft |
|---|---|---|---|---|
| 02/03/2025 02/03/25 | Price Changed | $1,350,000 | +13400.0% | -- |
| 02/03/2025 02/03/25 | For Sale | $10,000 | -- | -- |
Purchase History
| Date | Type | Sale Price | Title Company |
|---|---|---|---|
| Special Warranty Deed | -- | -- | |
| Special Warranty Deed | -- | -- | |
| Warranty Deed | -- | Pinnacle Land Title Co Inc | |
| Quit Claim Deed | -- | Pinnacle Land Title Co Inc | |
| Interfamily Deed Transfer | -- | None Available | |
| Interfamily Deed Transfer | -- | None Available | |
| Interfamily Deed Transfer | -- | -- | |
| Quit Claim Deed | $31,250 | -- | |
| Interfamily Deed Transfer | -- | -- | |
| Interfamily Deed Transfer | -- | -- |
Mortgage History
| Date | Status | Loan Amount | Loan Type |
|---|---|---|---|
| Previous Owner | $135,500 | Purchase Money Mortgage |
Source: MIBOR Broker Listing Cooperative®
MLS Number: 22020428
APN: 29-01-31-000-025.000-001
Disclaimer: Certain information contained herein is derived from information provided by parties other than Homes.com. All information provided is deemed reliable, but is not guaranteed to be accurate and should be independently verified.
![]() Based on information submitted to the MLS GRID. All data is obtained from various sources and may not have been verified by broker or MLS GRID. Supplied Open House Information is subject to change without notice. All information should be independently reviewed and verified for accuracy. Properties may or may not be listed by the office/agent presenting the information. Some IDX listings have been excluded from this website.
Based on information submitted to the MLS GRID. All data is obtained from various sources and may not have been verified by broker or MLS GRID. Supplied Open House Information is subject to change without notice. All information should be independently reviewed and verified for accuracy. Properties may or may not be listed by the office/agent presenting the information. Some IDX listings have been excluded from this website.
- 24500 Jerkwater Rd
- 24453 Kercheval St
- 390 W State Road 38
- 405 W 3rd St
- 3375 Godby Dr
- 3352 Godby Dr
- 3310 Godby St
- 3346 Godby Dr
- 3310 Godby Dr
- 707 S Hamilton Ave
- Harmony Plan at Centre Place
- Stamford Plan at Centre Place
- Henley Plan at Centre Place
- Chatham Plan at Centre Place
- Holcombe Plan at Centre Place
- Aldridge Plan at Centre Place
- 414 Elm Ave
- 500 S California St
- 24145 Hinesley Rd
- 400 S Georgia St
- 503 E 4th St
- 424 W Warrior Ct
- 1461 Bigleaf Dr
- 228 Oakhurst Way
- 1067 Beck Way
- 1048 Bald Tree Dr
- 18703 Mithoff Ln
- 18661 Moray St
- 18661 Moray St
- 20021 Chad Hittle Dr
- 1405 Sunbrook Ct
- 17995 Cunningham Dr
- 19530 Chad Hittle Dr
- 268 Onset Way
- 17355 NE Wellburn Dr NE
- 20074 Edwick Dr
- 17309 Wellburn Dr
- 2157 Egbert Rd
- 17333 Gibbons Place
- 1987 Mildred Rd
