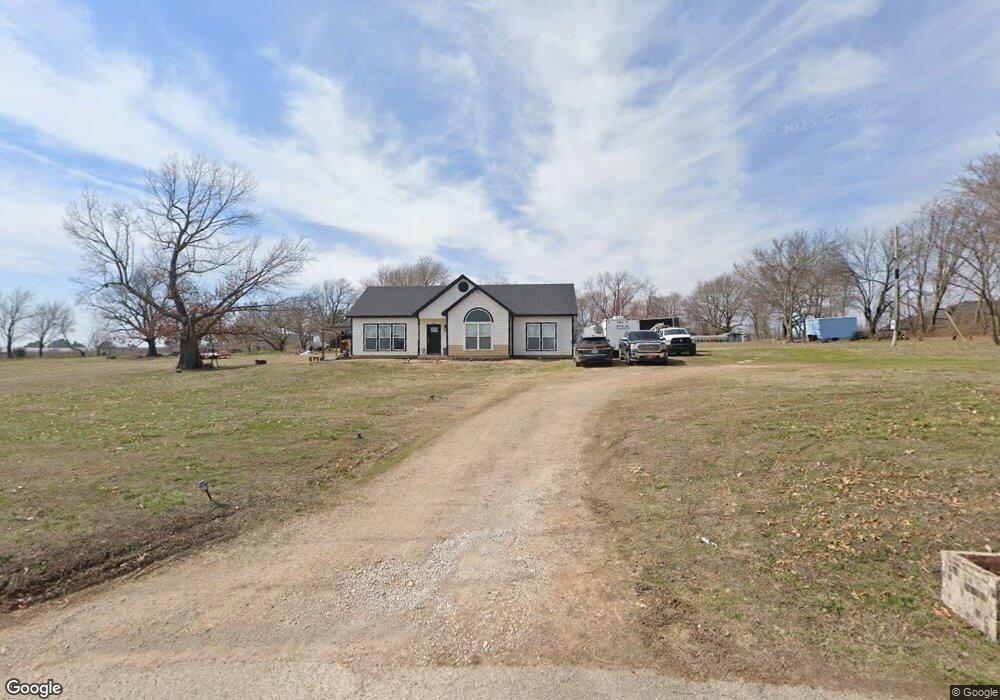
4058 Kelly Rd Springdale, AR 72762
Estimated Value: $292,000 - $378,000
--
Bed
2
Baths
1,540
Sq Ft
$217/Sq Ft
Est. Value
About This Home
This home is located at 4058 Kelly Rd, Springdale, AR 72762 and is currently estimated at $334,011, approximately $216 per square foot. 4058 Kelly Rd is a home located in Benton County with nearby schools including Willis Shaw Elementary School, Hellstern Middle School, and Central Junior High School.
Ownership History
Date
Name
Owned For
Owner Type
Purchase Details
Closed on
Aug 12, 2021
Sold by
Marchant and Bettie
Bought by
Gil-Arteaga Jorge
Current Estimated Value
Purchase Details
Closed on
Sep 16, 2020
Sold by
Marchant Darel L
Bought by
Gil-Arteaga Jorge
Purchase Details
Closed on
Mar 22, 2016
Sold by
U S Bank Trust Na
Bought by
Gil Arteaga Jorge
Home Financials for this Owner
Home Financials are based on the most recent Mortgage that was taken out on this home.
Original Mortgage
$97,484
Interest Rate
3.62%
Mortgage Type
New Conventional
Purchase Details
Closed on
Apr 30, 2015
Sold by
Marchant Eddie L and Marchant Jill L
Bought by
U S Bank Trust Na
Purchase Details
Closed on
Dec 7, 2010
Sold by
Marchant Jill
Bought by
Marchant Eddie
Purchase Details
Closed on
Dec 6, 1999
Bought by
Marchant 1Ac
Create a Home Valuation Report for This Property
The Home Valuation Report is an in-depth analysis detailing your home's value as well as a comparison with similar homes in the area
Home Values in the Area
Average Home Value in this Area
Purchase History
| Date | Buyer | Sale Price | Title Company |
|---|---|---|---|
| Gil-Arteaga Jorge | -- | None Listed On Document | |
| Gil-Arteaga Jorge | -- | None Listed On Document | |
| Gil Arteaga Jorge | $97,484 | Associates Closing & Title L | |
| U S Bank Trust Na | $144,434 | Attorney | |
| Marchant Eddie | -- | None Available | |
| Marchant 1Ac | -- | -- |
Source: Public Records
Mortgage History
| Date | Status | Borrower | Loan Amount |
|---|---|---|---|
| Previous Owner | Gil Arteaga Jorge | $97,484 |
Source: Public Records
Tax History Compared to Growth
Tax History
| Year | Tax Paid | Tax Assessment Tax Assessment Total Assessment is a certain percentage of the fair market value that is determined by local assessors to be the total taxable value of land and additions on the property. | Land | Improvement |
|---|---|---|---|---|
| 2025 | $1,557 | $54,824 | $15,870 | $38,954 |
| 2024 | $1,520 | $54,824 | $15,870 | $38,954 |
| 2023 | $1,447 | $34,160 | $8,510 | $25,650 |
| 2022 | $1,012 | $34,160 | $8,510 | $25,650 |
| 2021 | $944 | $34,160 | $8,510 | $25,650 |
| 2020 | $883 | $23,610 | $5,000 | $18,610 |
| 2019 | $883 | $23,610 | $5,000 | $18,610 |
| 2018 | $908 | $23,610 | $5,000 | $18,610 |
| 2017 | $1,258 | $23,610 | $5,000 | $18,610 |
| 2016 | $1,258 | $23,610 | $5,000 | $18,610 |
| 2015 | $1,133 | $21,250 | $3,000 | $18,250 |
| 2014 | $1,133 | $21,250 | $3,000 | $18,250 |
Source: Public Records
Map
Nearby Homes
- 704 Quail Run
- 3870 Als Dr
- 4022 Als Dr
- 13528 Kelly Rd
- 811 Valley Ln
- 9149 Marchant Rd
- 4095 Highway 112
- 3423 Roma Dr
- Lot 24 Buck Ave
- 705 Oriole Dr
- 4859 Highway 112
- 946 Water Ave
- 276 N Elm St
- 12973 Colonel Myers Rd
- Lot 4 Pintail Ln
- 813 Lancelot Dr
- 7889 Scenic Valley Ave
- 12214 Kenneth Price Rd
- 7887 Scenic Valley Ave
- Lot1, Block 2 Pintail Ln
- ??? N Kelly and Orin Rd
- 4157 N Robbins Rd
- 4083 Robbins Rd
- 4163 Kelly Rd
- 4163 Kelly Rd
- 3968 Robbins Rd
- 4185 Kelly Rd
- 0 Robbins Rd Unit 593836
- 0 Robbins Rd Unit 1151437
- 0 Robbins Rd Unit 1066527
- 4215 Robbins Rd
- 4267 Kelly Rd
- 4236 Robbins Rd
- 10038 Marchant Rd
- 4148 Robbins Rd
- 4266 Robbins Rd
- 0 Kelley Rd
- 10354 Marchant Rd
- 10354 Marchant Rd
- 10280 Marchant Rd