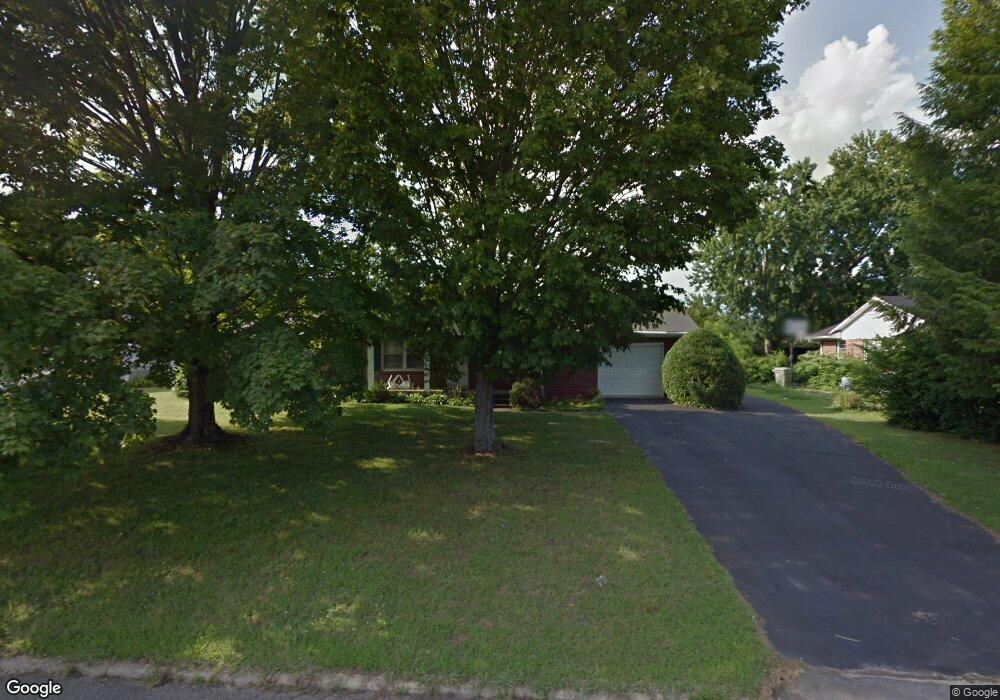
406 Robins St Lawrenceburg, TN 38464
Estimated Value: $199,731 - $258,000
--
Bed
2
Baths
1,377
Sq Ft
$166/Sq Ft
Est. Value
About This Home
This home is located at 406 Robins St, Lawrenceburg, TN 38464 and is currently estimated at $228,183, approximately $165 per square foot. 406 Robins St is a home located in Lawrence County with nearby schools including Ingram Sowell Elementary School, Lawrenceburg Public Elementary School, and David Crockett Elementary School.
Ownership History
Date
Name
Owned For
Owner Type
Purchase Details
Closed on
Oct 15, 2019
Sold by
Murrell Nellie F and Oxford Steven R
Bought by
Murrell Nellie F
Current Estimated Value
Purchase Details
Closed on
Aug 22, 2005
Sold by
Fred Konig
Bought by
Arnold Murrell
Home Financials for this Owner
Home Financials are based on the most recent Mortgage that was taken out on this home.
Original Mortgage
$60,000
Interest Rate
5.64%
Purchase Details
Closed on
Oct 29, 1998
Sold by
Mildred Konig
Bought by
Konig Family Rev Trust
Purchase Details
Closed on
Aug 5, 1988
Bought by
Konig Mildred and Bessie Konig
Create a Home Valuation Report for This Property
The Home Valuation Report is an in-depth analysis detailing your home's value as well as a comparison with similar homes in the area
Home Values in the Area
Average Home Value in this Area
Purchase History
| Date | Buyer | Sale Price | Title Company |
|---|---|---|---|
| Murrell Nellie F | -- | None Available | |
| Arnold Murrell | $80,000 | -- | |
| Konig Family Rev Trust | -- | -- | |
| Konig Family Rev Trust | $48,500 | -- | |
| Konig Mildred | -- | -- |
Source: Public Records
Mortgage History
| Date | Status | Borrower | Loan Amount |
|---|---|---|---|
| Closed | Konig Mildred | $60,000 |
Source: Public Records
Tax History Compared to Growth
Tax History
| Year | Tax Paid | Tax Assessment Tax Assessment Total Assessment is a certain percentage of the fair market value that is determined by local assessors to be the total taxable value of land and additions on the property. | Land | Improvement |
|---|---|---|---|---|
| 2025 | $1,246 | $40,100 | $0 | $0 |
| 2024 | $1,246 | $40,100 | $4,250 | $35,850 |
| 2023 | $1,246 | $40,100 | $4,250 | $35,850 |
| 2022 | $1,246 | $40,100 | $4,250 | $35,850 |
| 2021 | $961 | $21,875 | $4,250 | $17,625 |
| 2020 | $961 | $21,875 | $4,250 | $17,625 |
| 2019 | $961 | $21,875 | $4,250 | $17,625 |
| 2018 | $961 | $21,875 | $4,250 | $17,625 |
| 2017 | $961 | $21,875 | $4,250 | $17,625 |
| 2016 | $961 | $21,875 | $4,250 | $17,625 |
| 2015 | $910 | $21,875 | $4,250 | $17,625 |
| 2014 | $877 | $21,075 | $3,750 | $17,325 |
Source: Public Records
Map
Nearby Homes