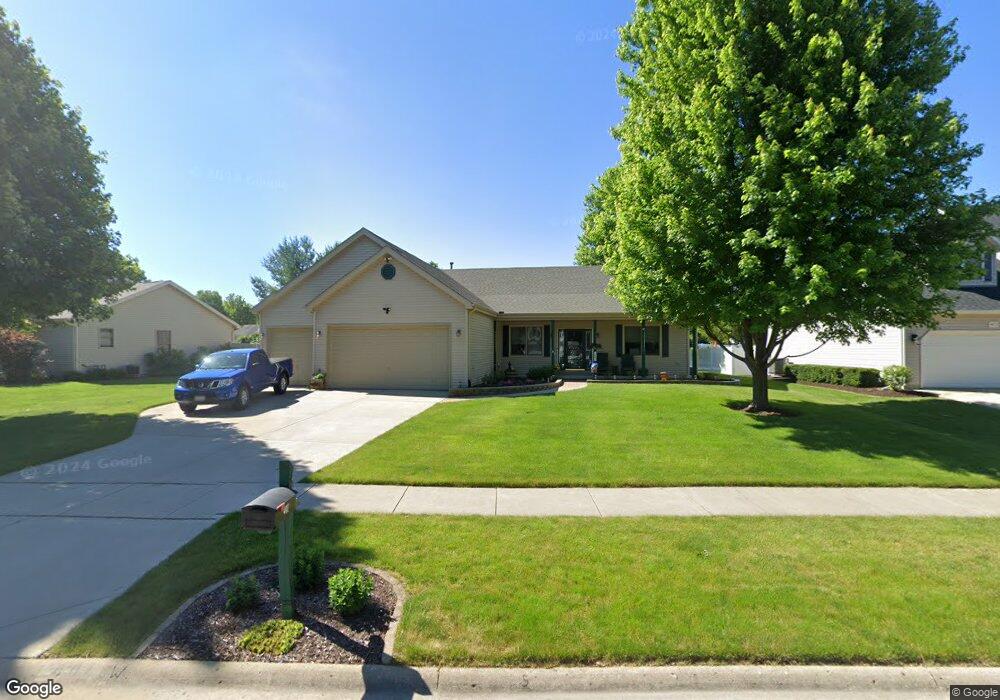
407 E Barberry Cir Unit 3 Yorkville, IL 60560
Estimated Value: $402,000 - $410,000
3
Beds
4
Baths
1,752
Sq Ft
$232/Sq Ft
Est. Value
About This Home
This home is located at 407 E Barberry Cir Unit 3, Yorkville, IL 60560 and is currently estimated at $407,144, approximately $232 per square foot. 407 E Barberry Cir Unit 3 is a home located in Kendall County with nearby schools including Circle Center Grade School, Yorkville Intermediate School, and Yorkville Middle School.
Ownership History
Date
Name
Owned For
Owner Type
Purchase Details
Closed on
Feb 28, 2024
Sold by
Rogers Kenneth C and Rogers Cynthia K
Bought by
Kenneth C Rogers And Cynthia K Rogers Living and Rogers
Current Estimated Value
Purchase Details
Closed on
Sep 3, 2002
Sold by
The Old Second National Bank Of Aurora
Bought by
Tim Greyer Builders Inc
Create a Home Valuation Report for This Property
The Home Valuation Report is an in-depth analysis detailing your home's value as well as a comparison with similar homes in the area
Home Values in the Area
Average Home Value in this Area
Purchase History
| Date | Buyer | Sale Price | Title Company |
|---|---|---|---|
| Kenneth C Rogers And Cynthia K Rogers Living | -- | None Listed On Document | |
| Tim Greyer Builders Inc | $59,000 | -- |
Source: Public Records
Tax History Compared to Growth
Tax History
| Year | Tax Paid | Tax Assessment Tax Assessment Total Assessment is a certain percentage of the fair market value that is determined by local assessors to be the total taxable value of land and additions on the property. | Land | Improvement |
|---|---|---|---|---|
| 2024 | $8,274 | $111,059 | $13,740 | $97,319 |
| 2023 | $8,373 | $97,875 | $13,603 | $84,272 |
| 2022 | $8,373 | $97,700 | $13,428 | $84,272 |
| 2021 | $8,274 | $94,610 | $17,123 | $77,487 |
| 2020 | $8,088 | $91,080 | $17,090 | $73,990 |
| 2019 | $7,854 | $87,150 | $16,788 | $70,362 |
| 2018 | $8,248 | $84,346 | $16,788 | $67,558 |
| 2017 | $8,234 | $82,083 | $16,337 | $65,746 |
| 2016 | $8,135 | $78,962 | $15,912 | $63,050 |
| 2015 | $7,823 | $72,994 | $14,506 | $58,488 |
| 2014 | -- | $70,137 | $14,434 | $55,703 |
| 2013 | -- | $70,137 | $14,434 | $55,703 |
Source: Public Records
Map
Nearby Homes
- 510 W Dolph St Unit 2
- 1459 Wood Sage Ave
- 807 State St
- 9211 Illinois 126
- 705 State St
- 664 White Oak Way
- 706 S Main St
- W Fox Rd
- 312 Olsen St
- 467 Poplar Dr
- 303 E Fox Rd
- 301 E Van Emmon St
- 852 Timber Oak Ln
- 232 Windham Cir
- The Mullberry Plan at Timber Ridge Estates
- 97 Crooked Creek Dr
- 2039 Muirfield Dr Unit 1881
- 2054 Kingsmill Ct
- 403 W Somonauk St
- 2328 Noble Ln
- 411 E Barberry Cir Unit 3
- 403 E Barberry Cir
- 1252 Walsh Dr Unit 3
- 491 Spice Bush Ct Unit 3
- 423 E Barberry Cir
- 406 E Barberry Cir
- 402 E Barberry Cir
- 433 E Barberry Cir
- 410 E Barberry Cir
- 1292 Walsh Dr Unit 3
- 487 Spice Bush Ct Unit 3
- 443 E Barberry Cir
- 1209 Walsh Dr
- 412 E Barberry Cir
- 447 E Barberry Cir Unit 3
- 1267 Walsh Dr
- 422 E Barberry Cir
- 1189 Walsh Dr
- 428 E Barberry Cir
- 1295 Walsh Dr Unit 3