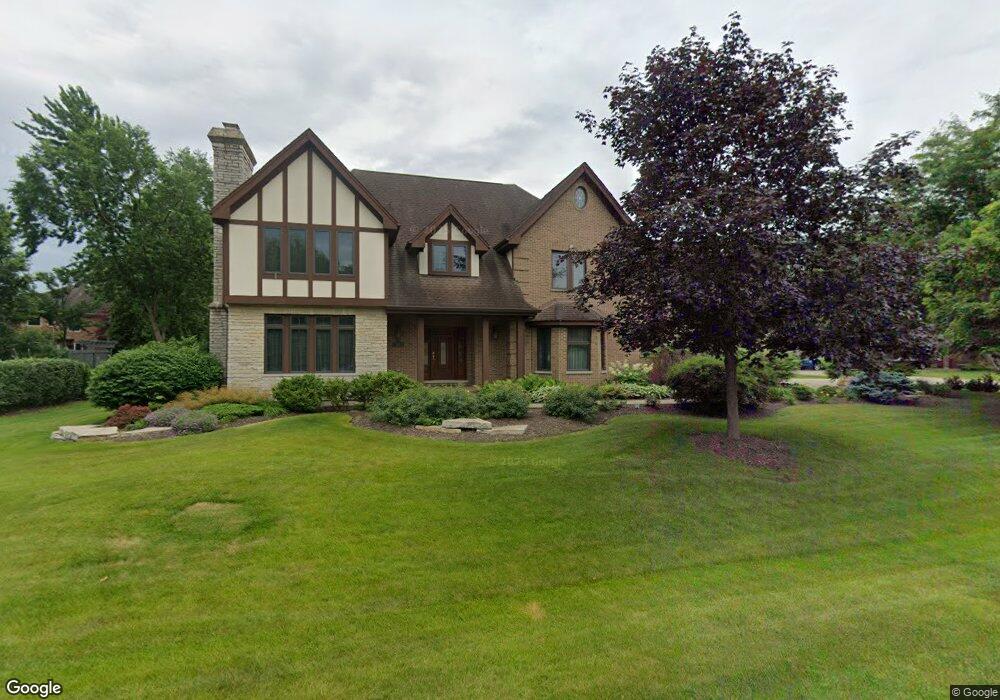
407 Periwinkle Way Prospect Heights, IL 60070
Estimated Value: $852,000 - $1,220,000
4
Beds
5
Baths
4,639
Sq Ft
$213/Sq Ft
Est. Value
About This Home
This home is located at 407 Periwinkle Way, Prospect Heights, IL 60070 and is currently estimated at $986,513, approximately $212 per square foot. 407 Periwinkle Way is a home located in Cook County with nearby schools including Dwight D Eisenhower Elementary School, Anne Sullivan Elementary School, and Betsy Ross Elementary School.
Ownership History
Date
Name
Owned For
Owner Type
Purchase Details
Closed on
Dec 4, 2015
Sold by
Grassi Michael G and Grassi Frances A
Bought by
Grassi Frances A and The Frances A Grassi Declaration Of Trus
Current Estimated Value
Purchase Details
Closed on
Mar 26, 2004
Sold by
Grassi Frances A
Bought by
Grassi Michael G and Grassi Frances A
Purchase Details
Closed on
Jul 7, 1998
Sold by
Grassi Michael G and Grassi Frances A
Bought by
Grassi Frances A and The Frances A Grassi Declaration Of Tr
Purchase Details
Closed on
Apr 23, 1998
Sold by
Grassi Frances A
Bought by
Grassi Michael G and Grassi Frances A
Home Financials for this Owner
Home Financials are based on the most recent Mortgage that was taken out on this home.
Original Mortgage
$480,000
Outstanding Balance
$90,720
Interest Rate
7.05%
Estimated Equity
$895,793
Create a Home Valuation Report for This Property
The Home Valuation Report is an in-depth analysis detailing your home's value as well as a comparison with similar homes in the area
Home Values in the Area
Average Home Value in this Area
Purchase History
| Date | Buyer | Sale Price | Title Company |
|---|---|---|---|
| Grassi Frances A | -- | Attorney | |
| Grassi Michael G | -- | -- | |
| Grassi Frances A | -- | -- | |
| Grassi Michael G | -- | -- |
Source: Public Records
Mortgage History
| Date | Status | Borrower | Loan Amount |
|---|---|---|---|
| Open | Grassi Michael G | $480,000 |
Source: Public Records
Tax History Compared to Growth
Tax History
| Year | Tax Paid | Tax Assessment Tax Assessment Total Assessment is a certain percentage of the fair market value that is determined by local assessors to be the total taxable value of land and additions on the property. | Land | Improvement |
|---|---|---|---|---|
| 2024 | $18,963 | $65,212 | $16,131 | $49,081 |
| 2023 | $17,726 | $69,063 | $16,131 | $52,932 |
| 2022 | $17,726 | $69,063 | $16,131 | $52,932 |
| 2021 | $19,305 | $64,869 | $10,082 | $54,787 |
| 2020 | $18,825 | $64,869 | $10,082 | $54,787 |
| 2019 | $20,001 | $76,738 | $10,082 | $66,656 |
| 2018 | $21,202 | $74,768 | $8,569 | $66,199 |
| 2017 | $21,822 | $74,768 | $8,569 | $66,199 |
| 2016 | $20,563 | $74,768 | $8,569 | $66,199 |
| 2015 | $21,797 | $71,997 | $7,561 | $64,436 |
| 2014 | $23,106 | $76,893 | $7,561 | $69,332 |
| 2013 | $22,520 | $76,893 | $7,561 | $69,332 |
Source: Public Records
Map
Nearby Homes
- 412 Cherry Creek Ln
- 1044 Creekside Ct Unit 2B
- 1500 Harbour Dr Unit 1D
- 1500 Harbour Dr Unit 2K
- 1054 Harbour Ct Unit 1A
- 1038 Harbour Ct Unit 2A
- 21 E Stonegate Dr
- 2143 E Peachtree Ln
- 2060 N Charter Point Dr Unit 14
- 791 Lakeside Circle Dr Unit 1
- 10 N Wildwood Dr
- 2812 Jackson Dr
- 1925 E Waverly Ln
- 2822 Jackson Dr
- 705 Lakeside Circle Dr Unit 2
- 1964 N Coldspring Rd Unit 52
- 307 Anne Ct
- 1014 N Elmhurst Rd
- 691 Lakeside Circle Dr
- 2616 N Prindle Ave
- 406 Walden Ln
- 405 Periwinkle Way
- 406 Periwinkle Way
- 404 Walden Ln
- 409 Periwinkle Way
- 404 Periwinkle Way
- 408 Walden Ln
- 408 Periwinkle Way
- 403 Periwinkle Way
- 1101 Pin Oak Ln
- 402 Walden Ln
- 402 Periwinkle Way
- 407 Walden Ln
- 409 Walden Ln
- 410 Walden Ln
- 405 Walden Ln
- 410 Periwinkle Way
- 1100 Prairie Cir
- 1100 Pin Oak Ln
- 411 Periwinkle Way