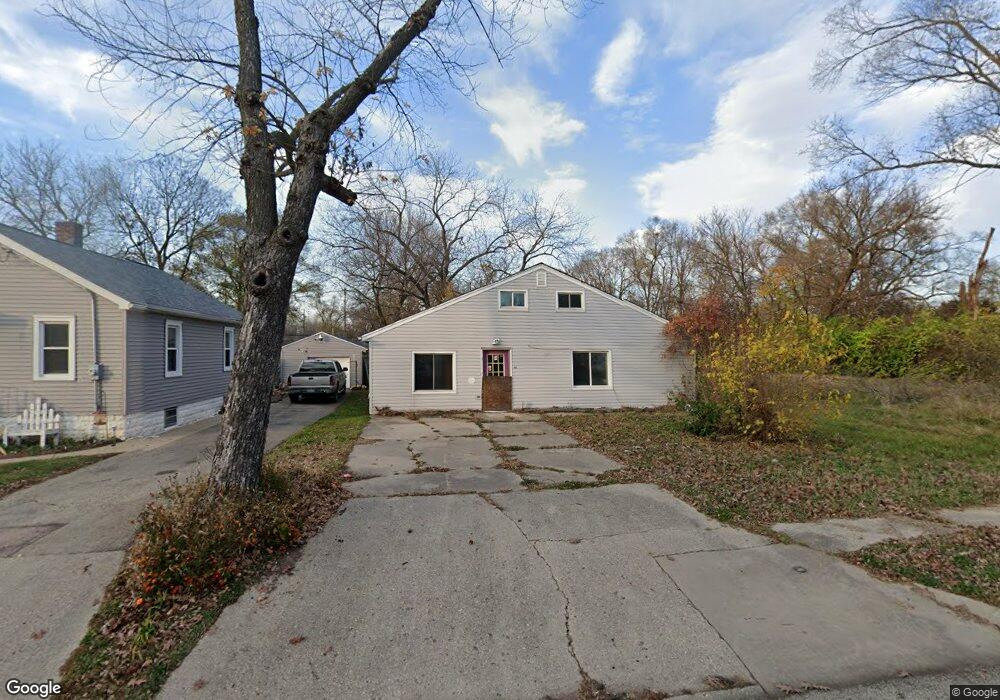
408 Fitch Rd Rockford, IL 61109
Estimated Value: $102,000 - $118,000
3
Beds
2
Baths
1,368
Sq Ft
$80/Sq Ft
Est. Value
About This Home
This home is located at 408 Fitch Rd, Rockford, IL 61109 and is currently estimated at $109,852, approximately $80 per square foot. 408 Fitch Rd is a home located in Winnebago County with nearby schools including Riverdahl Elementary School, Rockford Environmental Science Academy, and Jefferson High School.
Ownership History
Date
Name
Owned For
Owner Type
Purchase Details
Closed on
Jan 22, 2020
Sold by
Ingersoll Financial Midwest Land Trust
Bought by
Midwest Home Management Llc
Current Estimated Value
Purchase Details
Closed on
Dec 16, 2016
Sold by
Federal Natl Mtg Assn Fnma
Bought by
Ingersoll Financial Midwest La
Purchase Details
Closed on
Jun 23, 2016
Sold by
Federal Natl Mtg Assn Fnma
Bought by
Ingersoll Financial Midwest La
Purchase Details
Closed on
Jun 3, 2014
Bought by
Harbour Portfolio Viii Lp
Create a Home Valuation Report for This Property
The Home Valuation Report is an in-depth analysis detailing your home's value as well as a comparison with similar homes in the area
Home Values in the Area
Average Home Value in this Area
Purchase History
| Date | Buyer | Sale Price | Title Company |
|---|---|---|---|
| Midwest Home Management Llc | -- | Peppiatt Aubrie | |
| Ingersoll Financial Midwest La | -- | Servicelink | |
| Ingersoll Financial Midwest La | -- | Servicelink | |
| Harbour Portfolio Viii Lp | $9,200 | -- |
Source: Public Records
Tax History Compared to Growth
Tax History
| Year | Tax Paid | Tax Assessment Tax Assessment Total Assessment is a certain percentage of the fair market value that is determined by local assessors to be the total taxable value of land and additions on the property. | Land | Improvement |
|---|---|---|---|---|
| 2024 | $939 | $9,910 | $1,192 | $8,718 |
| 2023 | $907 | $8,738 | $1,051 | $7,687 |
| 2022 | $892 | $7,810 | $939 | $6,871 |
| 2021 | $878 | $7,161 | $861 | $6,300 |
| 2020 | $871 | $6,770 | $814 | $5,956 |
| 2019 | $865 | $6,453 | $776 | $5,677 |
| 2018 | $1,938 | $6,081 | $731 | $5,350 |
| 2017 | $1,359 | $9,159 | $700 | $8,459 |
| 2016 | $2,971 | $19,665 | $687 | $18,978 |
| 2015 | $3,008 | $19,665 | $687 | $18,978 |
| 2014 | $3,087 | $20,751 | $858 | $19,893 |
Source: Public Records
Map
Nearby Homes