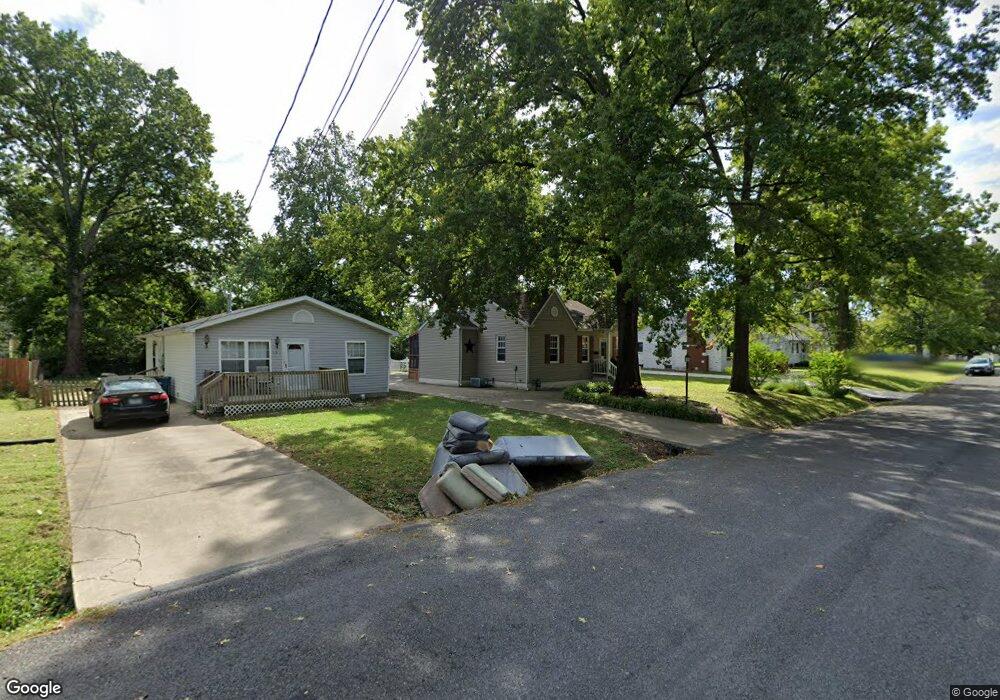
408 Greenwood Place Collinsville, IL 62234
Estimated Value: $169,564 - $223,000
--
Bed
--
Bath
1,263
Sq Ft
$157/Sq Ft
Est. Value
About This Home
This home is located at 408 Greenwood Place, Collinsville, IL 62234 and is currently estimated at $197,891, approximately $156 per square foot. 408 Greenwood Place is a home located in St. Clair County with nearby schools including Jefferson Elementary School, Dorris Intermediate School, and Collinsville Middle School.
Ownership History
Date
Name
Owned For
Owner Type
Purchase Details
Closed on
Jul 14, 2005
Sold by
Shortt Renee T and Shortt Paul Z
Bought by
Dickerman Michael E and Dickerman Stacy L
Current Estimated Value
Home Financials for this Owner
Home Financials are based on the most recent Mortgage that was taken out on this home.
Original Mortgage
$111,200
Outstanding Balance
$58,123
Interest Rate
5.68%
Mortgage Type
Fannie Mae Freddie Mac
Estimated Equity
$139,768
Purchase Details
Closed on
Sep 30, 2002
Sold by
Shortt Renee T and Shortt Paul Z
Bought by
Shortt Paul Z and Shortt Renee T
Home Financials for this Owner
Home Financials are based on the most recent Mortgage that was taken out on this home.
Original Mortgage
$78,017
Interest Rate
6.13%
Mortgage Type
Purchase Money Mortgage
Create a Home Valuation Report for This Property
The Home Valuation Report is an in-depth analysis detailing your home's value as well as a comparison with similar homes in the area
Home Values in the Area
Average Home Value in this Area
Purchase History
| Date | Buyer | Sale Price | Title Company |
|---|---|---|---|
| Dickerman Michael E | $142,500 | Abstracts & Titles Inc | |
| Shortt Paul Z | -- | -- |
Source: Public Records
Mortgage History
| Date | Status | Borrower | Loan Amount |
|---|---|---|---|
| Open | Dickerman Michael E | $111,200 | |
| Previous Owner | Shortt Paul Z | $78,017 |
Source: Public Records
Tax History Compared to Growth
Tax History
| Year | Tax Paid | Tax Assessment Tax Assessment Total Assessment is a certain percentage of the fair market value that is determined by local assessors to be the total taxable value of land and additions on the property. | Land | Improvement |
|---|---|---|---|---|
| 2024 | $3,151 | $53,047 | $3,901 | $49,146 |
| 2023 | $2,861 | $46,936 | $3,452 | $43,484 |
| 2022 | $2,637 | $43,900 | $3,383 | $40,517 |
| 2021 | $2,572 | $41,667 | $3,211 | $38,456 |
| 2020 | $2,522 | $39,468 | $3,041 | $36,427 |
| 2019 | $2,448 | $39,468 | $3,041 | $36,427 |
| 2018 | $2,019 | $33,460 | $2,866 | $30,594 |
| 2017 | $2,024 | $32,102 | $2,749 | $29,353 |
| 2016 | $2,057 | $31,377 | $2,687 | $28,690 |
| 2014 | $1,539 | $26,456 | $3,107 | $23,349 |
| 2013 | $1,653 | $26,943 | $3,164 | $23,779 |
Source: Public Records
Map
Nearby Homes
- 11 Davis Place
- 625 Greenwood Place
- 9 Grandview Dr
- 151 Helen Place
- 101 Osage Dr
- 202 Keeneland Ct
- 717 Greenwood Place
- 710 Saint Louis Rd
- 208 Coral Dr
- 116 Moffett Ave
- 114 Moffett Ave Unit 116
- 408 Hillside Dr
- 128 Courtland Place
- Lot 36 Jefferson Ave
- Lot 38 Jefferson Ave
- Lot 20 Jefferson Ave
- Lot 37 Jefferson Ave
- 1109 Saint Clair Ave
- 89 Fox Run Rd
- Lot 32 Jefferson Ave
- 406 Greenwood Place
- 412 Greenwood Place
- 404 Greenwood Place
- 414 Greenwood Place
- 402 Greenwood Place
- 211 Highland Place
- 207 Highland Place
- 213 Highland Place
- 409 Greenwood Place
- 205 Highland Place
- 400 Greenwood Place
- 413 Greenwood Place
- 405 Greenwood Place
- 405 Greenwood Place
- 215 Highland Place
- 203 Highland Place
- 427 Greenwood Place
- 403 Greenwood Place
- 401 Greenwood Place
- 201 Highland Place