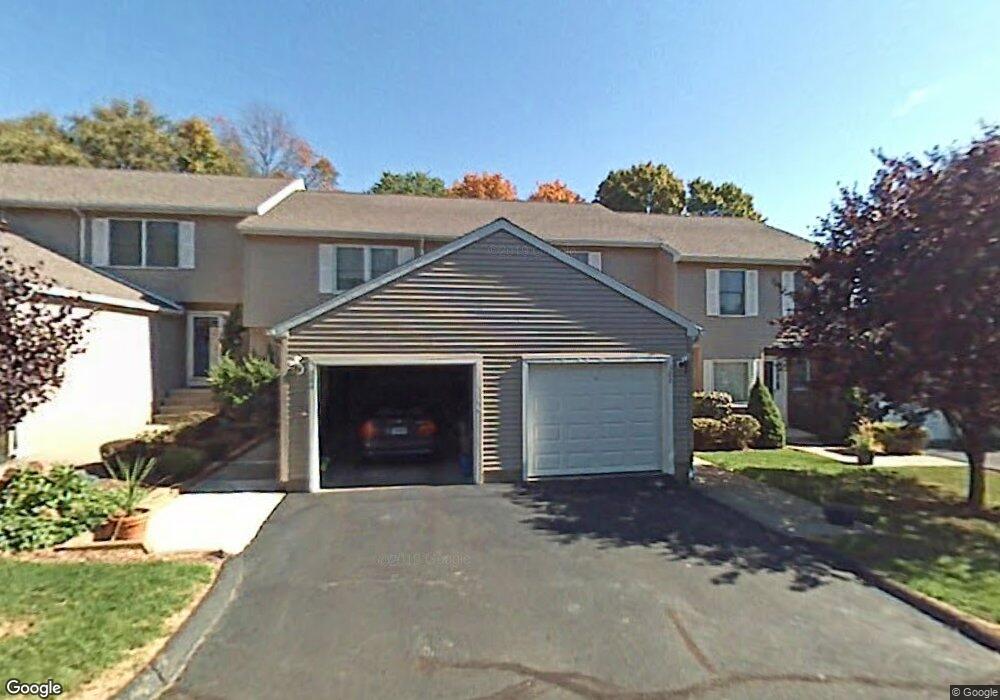
409 Holly Hill Dr Rocky Hill, CT 06067
Estimated Value: $287,000 - $367,000
2
Beds
3
Baths
1,196
Sq Ft
$283/Sq Ft
Est. Value
About This Home
This home is located at 409 Holly Hill Dr, Rocky Hill, CT 06067 and is currently estimated at $338,761, approximately $283 per square foot. 409 Holly Hill Dr is a home located in Hartford County with nearby schools including Albert D. Griswold Middle School and Rocky Hill High School.
Ownership History
Date
Name
Owned For
Owner Type
Purchase Details
Closed on
Nov 20, 2017
Sold by
Jacob Abby R and Skarvelas Haralambos
Bought by
Pompa Leeann M
Current Estimated Value
Home Financials for this Owner
Home Financials are based on the most recent Mortgage that was taken out on this home.
Original Mortgage
$168,000
Outstanding Balance
$140,776
Interest Rate
3.85%
Mortgage Type
Purchase Money Mortgage
Estimated Equity
$197,985
Purchase Details
Closed on
Jul 31, 2009
Sold by
Horvat Christopher
Bought by
Jacob Abby R and Skarvelas Haralambos
Home Financials for this Owner
Home Financials are based on the most recent Mortgage that was taken out on this home.
Original Mortgage
$225,342
Interest Rate
5.43%
Purchase Details
Closed on
May 5, 2006
Sold by
Borcynski Mary Jane
Bought by
Horvat Christopher
Purchase Details
Closed on
Jan 22, 1990
Sold by
Mangiafico Dev Corp
Bought by
Borcynski Mary Jane
Create a Home Valuation Report for This Property
The Home Valuation Report is an in-depth analysis detailing your home's value as well as a comparison with similar homes in the area
Home Values in the Area
Average Home Value in this Area
Purchase History
| Date | Buyer | Sale Price | Title Company |
|---|---|---|---|
| Pompa Leeann M | $210,000 | -- | |
| Pompa Leeann M | $210,000 | -- | |
| Jacob Abby R | $229,500 | -- | |
| Jacob Abby R | $229,500 | -- | |
| Horvat Christopher | $212,750 | -- | |
| Horvat Christopher | $212,750 | -- | |
| Borcynski Mary Jane | $154,500 | -- |
Source: Public Records
Mortgage History
| Date | Status | Borrower | Loan Amount |
|---|---|---|---|
| Open | Pompa Leeann M | $168,000 | |
| Closed | Pompa Leeann M | $168,000 | |
| Previous Owner | Borcynski Mary Jane | $225,342 |
Source: Public Records
Tax History Compared to Growth
Tax History
| Year | Tax Paid | Tax Assessment Tax Assessment Total Assessment is a certain percentage of the fair market value that is determined by local assessors to be the total taxable value of land and additions on the property. | Land | Improvement |
|---|---|---|---|---|
| 2025 | $4,479 | $148,120 | $0 | $148,120 |
| 2024 | $4,321 | $148,120 | $0 | $148,120 |
| 2023 | $3,399 | $94,640 | $0 | $94,640 |
| 2022 | $3,267 | $94,640 | $0 | $94,640 |
| 2021 | $3,227 | $94,640 | $0 | $94,640 |
| 2020 | $3,180 | $94,640 | $0 | $94,640 |
| 2019 | $3,076 | $94,640 | $0 | $94,640 |
| 2018 | $4,019 | $124,040 | $0 | $124,040 |
| 2017 | $3,920 | $124,040 | $0 | $124,040 |
| 2016 | $3,845 | $124,040 | $0 | $124,040 |
| 2015 | $3,684 | $124,040 | $0 | $124,040 |
| 2014 | $3,684 | $124,040 | $0 | $124,040 |
Source: Public Records
Map
Nearby Homes
- 24 Pine Meadow Rd
- 409 Carlton Ln Unit 409
- 18 Stone Hill Dr
- 53 Salem Dr
- 221 Westmeadow Rd
- 9 Coachmen Ln
- 78 Apple Hill
- 263 Two Rod Hwy
- 19 Sunnybrook Dr
- 42 Rose Ct
- 31 Woodsedge Dr Unit 1C
- 180 Hayes Rd
- 35 Woodsedge Dr Unit 4C
- 370 Hayes Rd
- 39 Pepper Bush Ln
- 231 Cottonwood Rd Unit 231
- 215 Cottonwood Rd
- 155 Cottonwood Rd
- 159 Cottonwood Rd Unit 159
- 6 Vinnie Dr
- 510 Holly Hill Dr
- 508 Holly Hill Dr
- 809 Holly Hill Dr
- 807 Holly Hill Dr
- 805 Holly Hill Dr
- 803 Holly Hill Dr
- 801 Holly Hill Dr
- 611 Holly Hill Dr
- 609 Holly Hill Dr
- 607 Holly Hill Dr
- 605 Holly Hill Dr
- 603 Holly Hill Dr
- 601 Holly Hill Dr
- 506 Holly Hill Dr
- 504 Holly Hill Dr
- 502 Holly Hill Dr
- 411 Holly Hill Dr
- 407 Holly Hill Dr
- 405 Holly Hill Dr
- 403 Holly Hill Dr