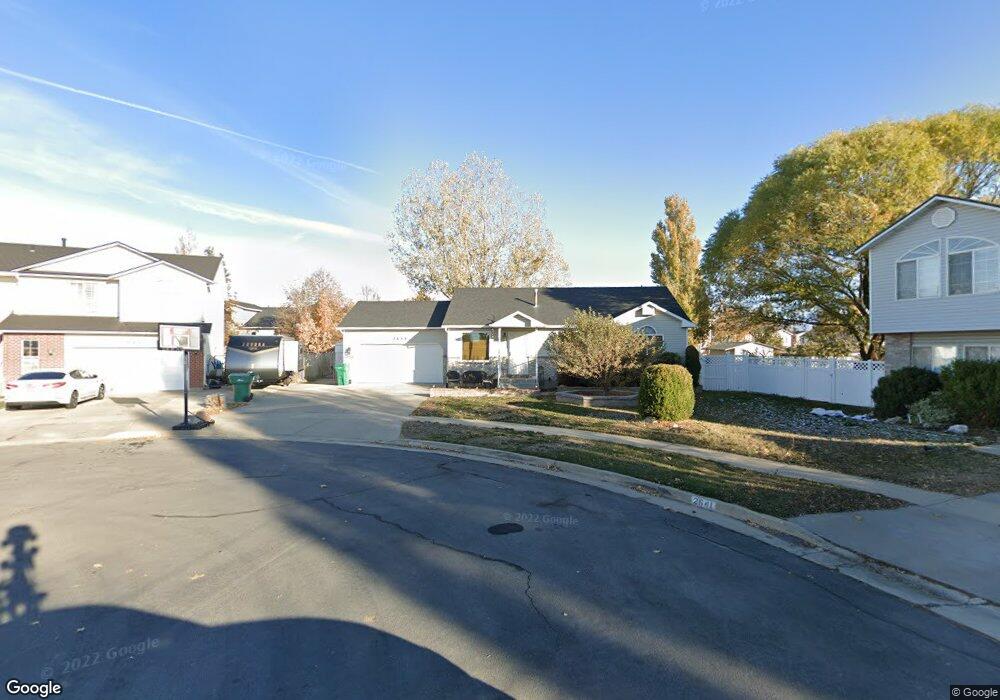
4091 W 1200 N Clearfield, UT 84015
Estimated Value: $800,000 - $1,047,000
6
Beds
4
Baths
4,258
Sq Ft
$211/Sq Ft
Est. Value
About This Home
This home is located at 4091 W 1200 N, Clearfield, UT 84015 and is currently estimated at $900,467, approximately $211 per square foot. 4091 W 1200 N is a home located in Davis County with nearby schools including West Point School, West Point Junior High School, and Syracuse High School.
Ownership History
Date
Name
Owned For
Owner Type
Purchase Details
Closed on
Aug 1, 2016
Sold by
Ornelas Brett K
Bought by
Ornelas Brett K and Ornelas Jentry Michele
Current Estimated Value
Purchase Details
Closed on
Apr 30, 2013
Sold by
Miller Stuart C and Miller Amber
Bought by
Curro Luis A and Curro Shawn M
Home Financials for this Owner
Home Financials are based on the most recent Mortgage that was taken out on this home.
Original Mortgage
$378,976
Interest Rate
3.51%
Mortgage Type
VA
Purchase Details
Closed on
Jun 7, 2010
Sold by
Craythorne Development Inc
Bought by
Miller Stuart C and Miller Amber
Home Financials for this Owner
Home Financials are based on the most recent Mortgage that was taken out on this home.
Original Mortgage
$253,001
Interest Rate
5.05%
Mortgage Type
Construction
Purchase Details
Closed on
Feb 12, 2009
Sold by
Craythorne Construction Company Inc
Bought by
Craythorne Development Inc
Create a Home Valuation Report for This Property
The Home Valuation Report is an in-depth analysis detailing your home's value as well as a comparison with similar homes in the area
Home Values in the Area
Average Home Value in this Area
Purchase History
| Date | Buyer | Sale Price | Title Company |
|---|---|---|---|
| Ornelas Brett K | -- | Us Title | |
| Ornelas Brett K | -- | Us Title | |
| Curro Luis A | -- | First American Title | |
| Miller Stuart C | -- | Bonneville Superior | |
| Craythorne Development Inc | -- | Accommodation |
Source: Public Records
Mortgage History
| Date | Status | Borrower | Loan Amount |
|---|---|---|---|
| Previous Owner | Curro Luis A | $378,976 | |
| Previous Owner | Miller Stuart C | $253,001 |
Source: Public Records
Tax History Compared to Growth
Tax History
| Year | Tax Paid | Tax Assessment Tax Assessment Total Assessment is a certain percentage of the fair market value that is determined by local assessors to be the total taxable value of land and additions on the property. | Land | Improvement |
|---|---|---|---|---|
| 2025 | $4,642 | $435,050 | $138,726 | $296,324 |
| 2024 | $4,511 | $424,600 | $124,782 | $299,818 |
| 2023 | $3,725 | $645,000 | $162,409 | $482,591 |
| 2022 | $4,109 | $389,400 | $86,460 | $302,940 |
| 2021 | $3,815 | $541,000 | $127,545 | $413,455 |
| 2020 | $3,259 | $456,000 | $108,494 | $347,506 |
| 2019 | $3,312 | $457,000 | $104,857 | $352,143 |
| 2018 | $3,111 | $423,000 | $101,939 | $321,061 |
| 2016 | $3,024 | $216,370 | $39,569 | $176,801 |
| 2015 | $3,134 | $212,520 | $39,569 | $172,951 |
| 2014 | $2,785 | $191,465 | $39,569 | $151,896 |
| 2013 | -- | $193,048 | $46,093 | $146,955 |
Source: Public Records
Map
Nearby Homes
- 4469 W 1000 N Unit 120
- 1403 N 3850 W
- 3892 W 1450 N
- 3721 W 825 N Unit 101
- 3918 W 825 N Unit WF6
- 3877 W 825 N Unit WF21
- 4302 W 1550 N
- 1717 N 4325 W
- 1635 N 4625 W
- 3656 W 1800 N
- 357 N 4000 W
- 477 N 4500 W
- 4719 W 650 N
- 4352 W 300 N
- Charleston Plan at Bluff View
- 3168 W 1300 N
- 2084 N 4500 W
- 3949 W 250 N
- 399 N 3425 W
- 4366 W 200 N