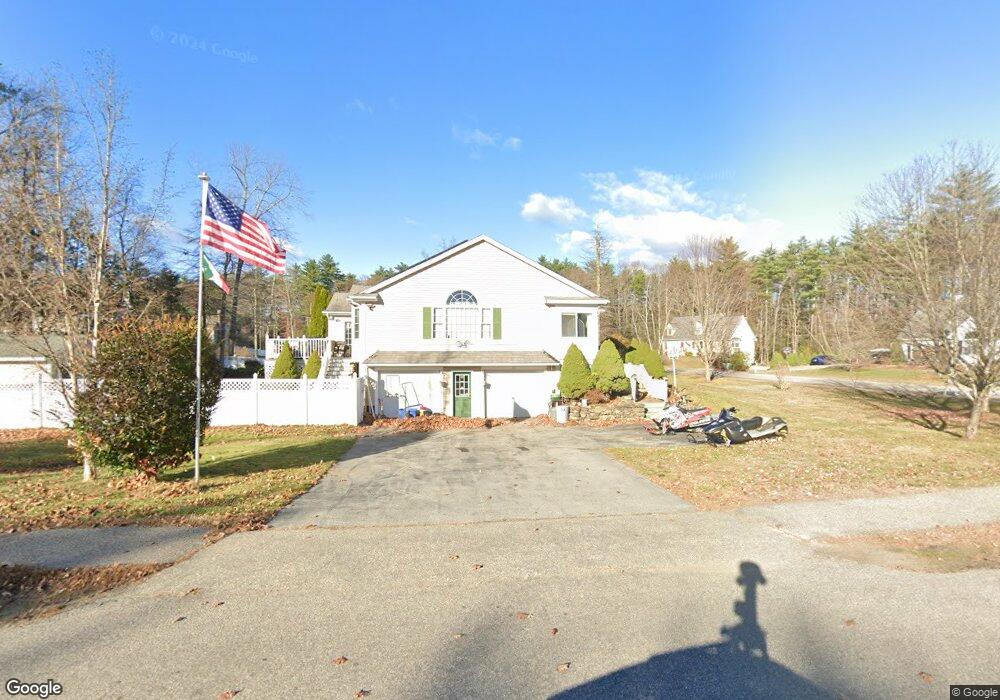
41 Border Winds Ave Seabrook, NH 03874
Estimated Value: $656,478 - $704,000
3
Beds
3
Baths
2,314
Sq Ft
$290/Sq Ft
Est. Value
About This Home
This home is located at 41 Border Winds Ave, Seabrook, NH 03874 and is currently estimated at $672,120, approximately $290 per square foot. 41 Border Winds Ave is a home located in Rockingham County with nearby schools including Seabrook Elementary School, Seabrook Middle School, and Winnacunnet High School.
Ownership History
Date
Name
Owned For
Owner Type
Purchase Details
Closed on
Sep 14, 2017
Sold by
Giordano Deborah
Bought by
Deborah J Giordano Ret
Current Estimated Value
Purchase Details
Closed on
Feb 11, 2011
Sold by
National Res Nominee S
Bought by
Giordano Deborah
Home Financials for this Owner
Home Financials are based on the most recent Mortgage that was taken out on this home.
Original Mortgage
$259,529
Interest Rate
4.88%
Mortgage Type
Purchase Money Mortgage
Purchase Details
Closed on
Jul 14, 2000
Sold by
Mcclellan Ho William C
Bought by
Hagan Paul E and Hagan Phyllis A
Purchase Details
Closed on
Jan 14, 2000
Sold by
Ledge Rd Rt
Bought by
Mcclellan Ho William C
Create a Home Valuation Report for This Property
The Home Valuation Report is an in-depth analysis detailing your home's value as well as a comparison with similar homes in the area
Home Values in the Area
Average Home Value in this Area
Purchase History
| Date | Buyer | Sale Price | Title Company |
|---|---|---|---|
| Deborah J Giordano Ret | -- | -- | |
| Giordano Deborah | $292,000 | -- | |
| National Res Nominee S | $292,000 | -- | |
| Hagan Paul E | $236,000 | -- | |
| Mcclellan Ho William C | $77,000 | -- |
Source: Public Records
Mortgage History
| Date | Status | Borrower | Loan Amount |
|---|---|---|---|
| Previous Owner | Mcclellan Ho William C | $257,590 | |
| Previous Owner | Mcclellan Ho William C | $259,529 | |
| Previous Owner | Mcclellan Ho William C | $95,200 |
Source: Public Records
Tax History Compared to Growth
Tax History
| Year | Tax Paid | Tax Assessment Tax Assessment Total Assessment is a certain percentage of the fair market value that is determined by local assessors to be the total taxable value of land and additions on the property. | Land | Improvement |
|---|---|---|---|---|
| 2024 | $6,614 | $564,300 | $267,200 | $297,100 |
| 2023 | $7,071 | $468,600 | $222,600 | $246,000 |
| 2022 | $6,209 | $468,600 | $222,600 | $246,000 |
| 2021 | $6,434 | $468,600 | $222,600 | $246,000 |
| 2020 | $5,685 | $356,000 | $169,300 | $186,700 |
| 2019 | $5,607 | $356,000 | $169,300 | $186,700 |
| 2018 | $5,785 | $356,000 | $169,300 | $186,700 |
| 2017 | $5,327 | $327,800 | $141,100 | $186,700 |
| 2016 | $4,848 | $327,800 | $141,100 | $186,700 |
| 2015 | $4,507 | $304,700 | $132,700 | $172,000 |
| 2014 | $4,653 | $304,700 | $132,700 | $172,000 |
| 2013 | $4,653 | $304,700 | $132,700 | $172,000 |
Source: Public Records
Map
Nearby Homes
- 75 Border Winds Ave
- 213 New Hampshire 107
- 22 Maple Ridge Rd
- 84 Blacksnake Rd Unit A
- 84 Blacksnake Rd Unit B
- 2 Adder Ln
- 61 Folly Mill Rd
- 106 Folly Mill Rd
- 81 Elm Ct
- 51 Locust St
- 20 Railroad Ave
- 253 Amesbury Rd
- 38 Rocks Rd Unit 2
- 38 Rocks Rd Unit 1
- 1 Stacey Ln
- 46 Kensington Rd
- 241 & 245 Lafayette Rd
- 10 High St
- 22 Farm Ln
- 28 Brooks Rd
- 55 Border Winds Ave
- 40 Border Winds Ave
- 48 Border Winds Ave
- 63 Border Winds Ave
- 44 Border Winds Ave
- 36 Border Winds Ave
- 33 Border Winds Ave
- 54 Border Winds Ave
- 56 Border Winds Ave
- 67 Border Winds Ave
- 32 Border Winds Ave
- 62 Border Winds Ave
- 63 Ledge Rd
- 59 Ledge Rd Unit B
- 59 Ledge Rd Unit A
- 59 Ledge Rd Unit 3
- 59 Ledge Rd Unit 59-4
- 61 Ledge Rd
- 64 Border Winds Ave
- 29 Border Winds Ave