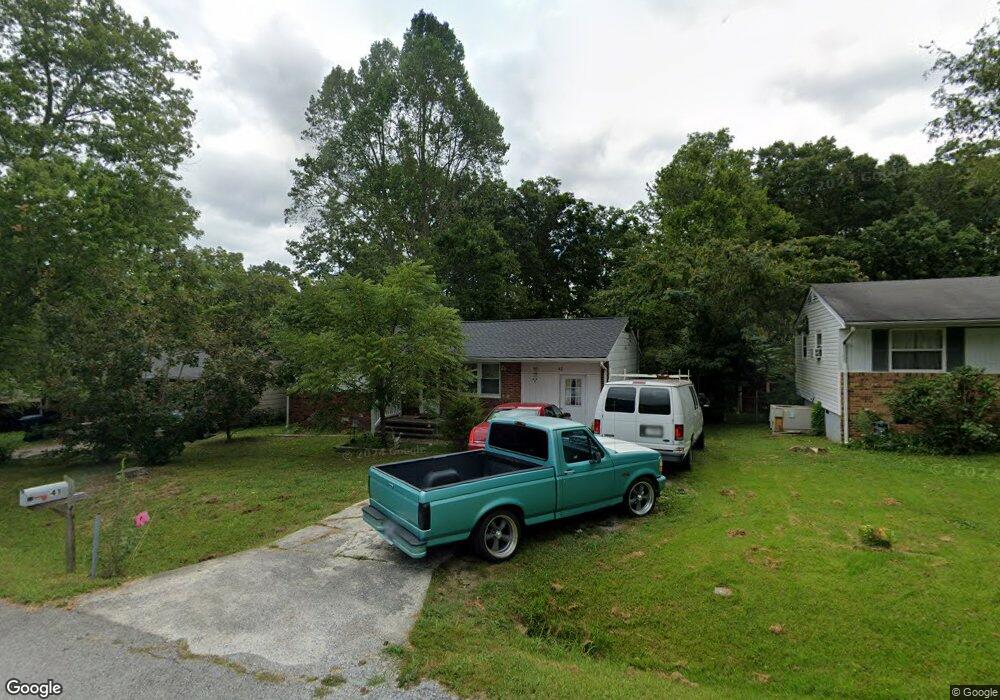
41 Darrell Ave Crossville, TN 38555
Estimated Value: $171,800 - $199,000
--
Bed
1
Bath
1,104
Sq Ft
$167/Sq Ft
Est. Value
About This Home
This home is located at 41 Darrell Ave, Crossville, TN 38555 and is currently estimated at $184,700, approximately $167 per square foot. 41 Darrell Ave is a home located in Cumberland County with nearby schools including Stone Elementary School, Stone Memorial High School, and Christian Academy of the Cumberlands.
Ownership History
Date
Name
Owned For
Owner Type
Purchase Details
Closed on
Aug 15, 2005
Sold by
Hubbard Edward E
Bought by
Cross Zola
Current Estimated Value
Home Financials for this Owner
Home Financials are based on the most recent Mortgage that was taken out on this home.
Original Mortgage
$35,975
Outstanding Balance
$18,789
Interest Rate
5.57%
Estimated Equity
$165,911
Purchase Details
Closed on
Mar 4, 1991
Bought by
Sec Of Housing & Urban Devl
Purchase Details
Closed on
Mar 3, 1991
Create a Home Valuation Report for This Property
The Home Valuation Report is an in-depth analysis detailing your home's value as well as a comparison with similar homes in the area
Home Values in the Area
Average Home Value in this Area
Purchase History
| Date | Buyer | Sale Price | Title Company |
|---|---|---|---|
| Cross Zola | $65,000 | -- | |
| Sec Of Housing & Urban Devl | $28,900 | -- | |
| -- | $28,900 | -- |
Source: Public Records
Mortgage History
| Date | Status | Borrower | Loan Amount |
|---|---|---|---|
| Open | -- | $35,975 |
Source: Public Records
Tax History Compared to Growth
Tax History
| Year | Tax Paid | Tax Assessment Tax Assessment Total Assessment is a certain percentage of the fair market value that is determined by local assessors to be the total taxable value of land and additions on the property. | Land | Improvement |
|---|---|---|---|---|
| 2024 | -- | $21,900 | $1,875 | $20,025 |
| 2023 | $0 | $21,900 | $0 | $0 |
| 2022 | $382 | $21,900 | $1,875 | $20,025 |
| 2021 | $250 | $10,825 | $1,875 | $8,950 |
| 2020 | $169 | $10,825 | $1,875 | $8,950 |
| 2019 | $233 | $10,825 | $1,875 | $8,950 |
| 2018 | $233 | $10,825 | $1,875 | $8,950 |
| 2017 | $233 | $10,825 | $1,875 | $8,950 |
| 2016 | $233 | $10,800 | $1,875 | $8,925 |
| 2015 | $230 | $10,800 | $1,875 | $8,925 |
| 2014 | $219 | $10,799 | $0 | $0 |
Source: Public Records
Map
Nearby Homes