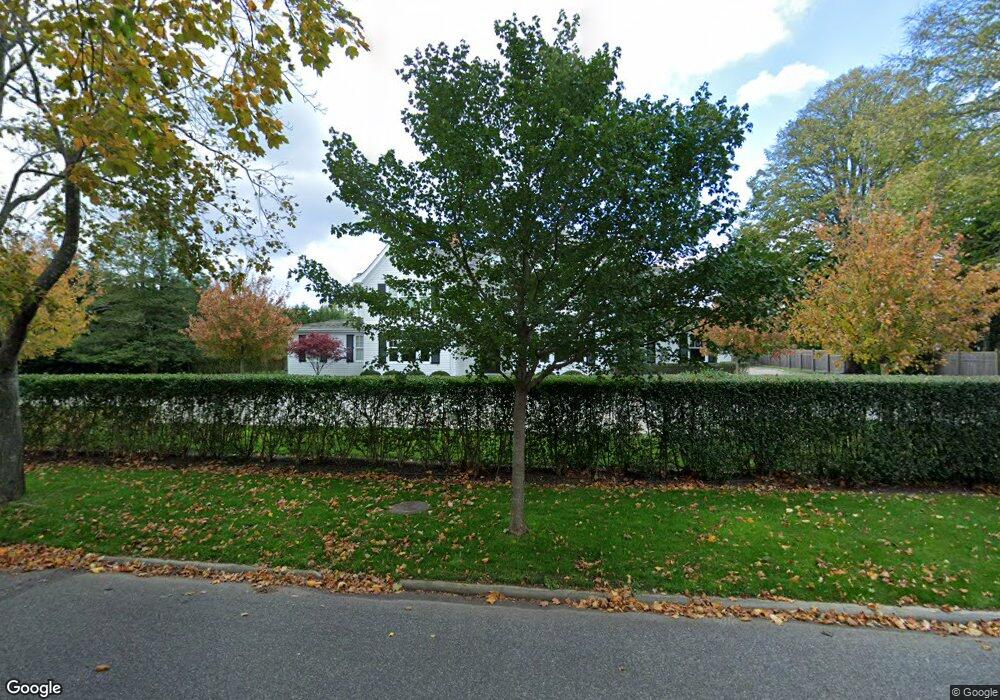
41 Herrick Rd Southampton, NY 11968
Estimated Value: $7,195,000 - $11,632,011
5
Beds
6
Baths
6,908
Sq Ft
$1,363/Sq Ft
Est. Value
About This Home
This home is located at 41 Herrick Rd, Southampton, NY 11968 and is currently estimated at $9,413,506, approximately $1,362 per square foot. 41 Herrick Rd is a home located in Suffolk County with nearby schools including Southampton Elementary School, Southampton Intermediate School, and Southampton High School.
Ownership History
Date
Name
Owned For
Owner Type
Purchase Details
Closed on
Aug 13, 2018
Sold by
Herrick Holdings Llc
Bought by
41 Herrick Llc
Current Estimated Value
Home Financials for this Owner
Home Financials are based on the most recent Mortgage that was taken out on this home.
Original Mortgage
$4,500,000
Outstanding Balance
$3,870,723
Interest Rate
4.5%
Mortgage Type
New Conventional
Estimated Equity
$5,542,783
Purchase Details
Closed on
Mar 13, 2015
Sold by
Kab Vyto and Kab Patricia
Bought by
Herrick Holdings Llc
Home Financials for this Owner
Home Financials are based on the most recent Mortgage that was taken out on this home.
Original Mortgage
$3,800,039
Interest Rate
3.75%
Mortgage Type
Purchase Money Mortgage
Purchase Details
Closed on
Jun 1, 2011
Sold by
Kaminsky Martin
Bought by
Kab Vyto and Kab Patricia
Purchase Details
Closed on
May 22, 2007
Purchase Details
Closed on
Feb 12, 2002
Sold by
Timmons Sanya
Bought by
Timmons Sanya and The Sanya Timmons Revocable Trust
Purchase Details
Closed on
Jul 18, 1995
Sold by
Timmons Benson E L and Timmons Sanya
Bought by
Timmons Benson E L and Timmons Sanya
Create a Home Valuation Report for This Property
The Home Valuation Report is an in-depth analysis detailing your home's value as well as a comparison with similar homes in the area
Home Values in the Area
Average Home Value in this Area
Purchase History
| Date | Buyer | Sale Price | Title Company |
|---|---|---|---|
| 41 Herrick Llc | $9,500,000 | -- | |
| Herrick Holdings Llc | -- | None Available | |
| Kab Vyto | $1,157,714 | -- | |
| -- | -- | -- | |
| Timmons Sanya | -- | Commonwealth Land Title Ins | |
| Timmons Benson E L | -- | Title Usa Insurance Corp |
Source: Public Records
Mortgage History
| Date | Status | Borrower | Loan Amount |
|---|---|---|---|
| Open | 41 Herrick Llc | $4,500,000 | |
| Previous Owner | Herrick Holdings Llc | $3,800,039 |
Source: Public Records
Tax History Compared to Growth
Tax History
| Year | Tax Paid | Tax Assessment Tax Assessment Total Assessment is a certain percentage of the fair market value that is determined by local assessors to be the total taxable value of land and additions on the property. | Land | Improvement |
|---|---|---|---|---|
| 2024 | $14,143 | $9,611,800 | $4,272,900 | $5,338,900 |
| 2023 | $14,143 | $9,611,800 | $4,272,900 | $5,338,900 |
| 2022 | $18,977 | $9,611,800 | $4,272,900 | $5,338,900 |
| 2021 | $18,977 | $9,611,800 | $4,272,900 | $5,338,900 |
| 2020 | $41,312 | $9,611,800 | $4,272,900 | $5,338,900 |
| 2019 | $40,821 | $0 | $0 | $0 |
| 2018 | -- | $9,490,400 | $3,898,600 | $5,591,800 |
| 2017 | $26,312 | $8,710,700 | $3,118,900 | $5,591,800 |
| 2016 | $23,624 | $7,490,800 | $3,118,900 | $4,371,900 |
| 2015 | -- | $5,794,800 | $3,118,900 | $2,675,900 |
| 2014 | -- | $2,688,900 | $2,495,100 | $193,800 |
Source: Public Records
Map
Nearby Homes
- 32 Toylsome Place
- 60 Culver St
- 66 Huntting St
- 121 Elm St
- 28 Bowden Square
- 57 Old Town Rd
- 15 Halsey Ave
- 179 Elm St
- 32 Cobblefield Ln
- 33 Halsey Ave
- 39 Halsey Ave
- 15 Prospect St
- 97 Pelletreau St
- 105 Willow St
- 222 White St
- 121 David Whites Ln
- 128 Halsey St
- 251 N Main St
- 20 Hillcrest Ave
- 129 David Whites Ln