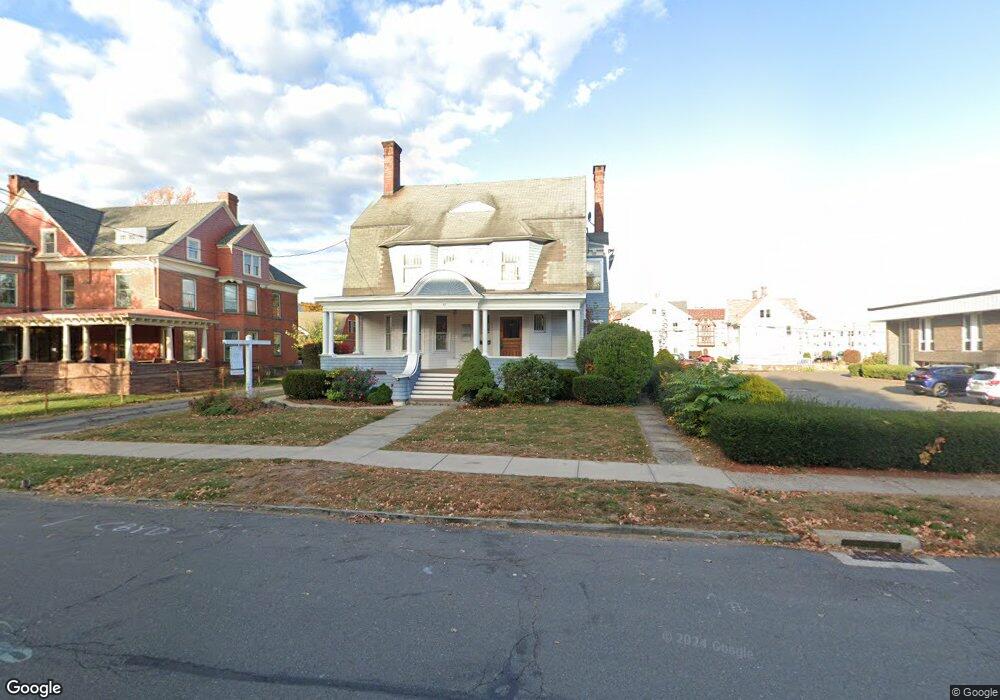
41 Lexington St New Britain, CT 06052
Estimated Value: $309,490
1
Bed
4
Baths
4,807
Sq Ft
$64/Sq Ft
Est. Value
About This Home
This home is located at 41 Lexington St, New Britain, CT 06052 and is currently estimated at $309,490, approximately $64 per square foot. 41 Lexington St is a home located in Hartford County with nearby schools including Lincoln School, Slade Middle School, and Mountain Laurel Sudbury School.
Ownership History
Date
Name
Owned For
Owner Type
Purchase Details
Closed on
Nov 18, 2024
Sold by
Garkar Associates Llc
Bought by
2126 Properties Llc
Current Estimated Value
Purchase Details
Closed on
Dec 22, 1988
Sold by
Pola Marina R
Bought by
Garkar Assoc
Create a Home Valuation Report for This Property
The Home Valuation Report is an in-depth analysis detailing your home's value as well as a comparison with similar homes in the area
Home Values in the Area
Average Home Value in this Area
Purchase History
| Date | Buyer | Sale Price | Title Company |
|---|---|---|---|
| 2126 Properties Llc | $285,000 | None Available | |
| 2126 Properties Llc | $285,000 | None Available | |
| Garkar Assoc | $288,000 | -- |
Source: Public Records
Mortgage History
| Date | Status | Borrower | Loan Amount |
|---|---|---|---|
| Previous Owner | Garkar Assoc | $175,000 | |
| Previous Owner | Garkar Assoc | $128,500 | |
| Previous Owner | Garkar Assoc | $205,000 | |
| Previous Owner | Garkar Assoc | $311,000 |
Source: Public Records
Tax History Compared to Growth
Tax History
| Year | Tax Paid | Tax Assessment Tax Assessment Total Assessment is a certain percentage of the fair market value that is determined by local assessors to be the total taxable value of land and additions on the property. | Land | Improvement |
|---|---|---|---|---|
| 2025 | $9,075 | $231,630 | $46,410 | $185,220 |
| 2024 | $9,170 | $231,630 | $46,410 | $185,220 |
| 2023 | $8,867 | $231,630 | $46,410 | $185,220 |
| 2022 | $9,040 | $182,630 | $40,740 | $141,890 |
| 2021 | $9,040 | $182,630 | $40,740 | $141,890 |
| 2020 | $9,223 | $182,630 | $40,740 | $141,890 |
| 2019 | $9,223 | $182,630 | $40,740 | $141,890 |
| 2018 | $9,223 | $182,630 | $40,740 | $141,890 |
| 2017 | $10,389 | $205,730 | $38,780 | $166,950 |
| 2016 | $10,389 | $205,730 | $38,780 | $166,950 |
| 2015 | $10,081 | $205,730 | $38,780 | $166,950 |
| 2014 | $10,081 | $205,730 | $38,780 | $166,950 |
Source: Public Records
Map
Nearby Homes