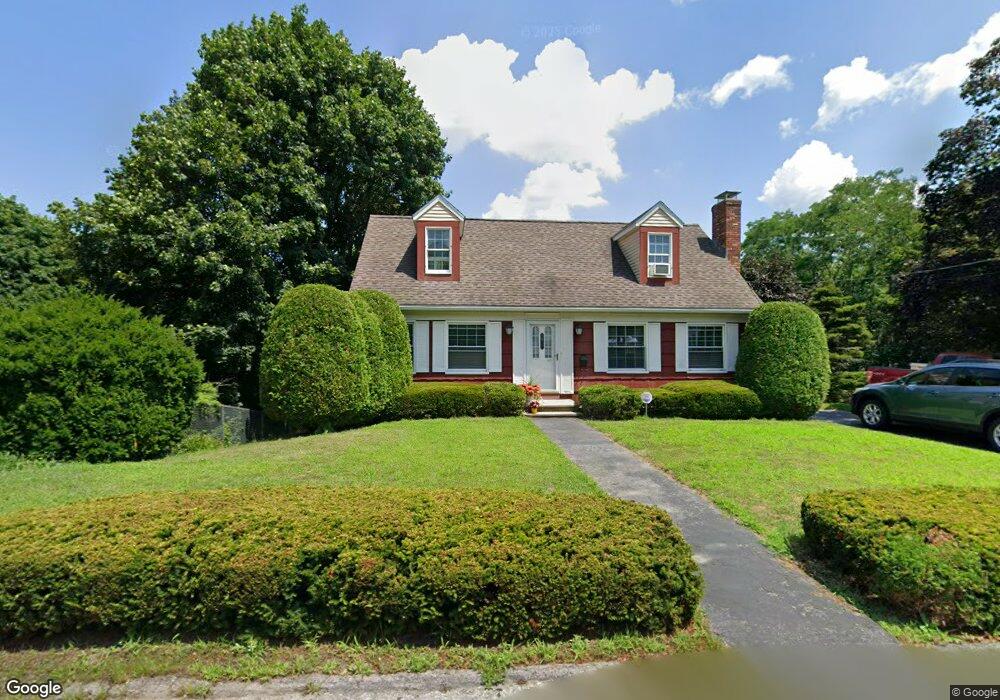
41 Llewellyn St Unit 41 Lowell, MA 01850
Centralville NeighborhoodEstimated Value: $542,000 - $595,000
3
Beds
2
Baths
2,304
Sq Ft
$244/Sq Ft
Est. Value
About This Home
This home is located at 41 Llewellyn St Unit 41, Lowell, MA 01850 and is currently estimated at $561,908, approximately $243 per square foot. 41 Llewellyn St Unit 41 is a home located in Middlesex County with nearby schools including S. Christa McAuliffe Elementary School, Greenhalge Elementary School, and Moody Elementary School.
Ownership History
Date
Name
Owned For
Owner Type
Purchase Details
Closed on
Nov 15, 2017
Sold by
White Thomas J
Bought by
Fryns Paul R and Fryns Michael E
Current Estimated Value
Home Financials for this Owner
Home Financials are based on the most recent Mortgage that was taken out on this home.
Original Mortgage
$252,000
Outstanding Balance
$210,660
Interest Rate
3.85%
Mortgage Type
New Conventional
Estimated Equity
$351,248
Purchase Details
Closed on
Apr 5, 2013
Sold by
Fhlmc
Bought by
White Thomas J
Purchase Details
Closed on
Jan 11, 2012
Sold by
Colton Jamie L and Gmac Mortgage Llc
Bought by
Fhlmc
Purchase Details
Closed on
Feb 27, 2009
Sold by
Colton Jamie L
Bought by
Demko Mathew R
Purchase Details
Closed on
Sep 29, 2006
Sold by
Levesque and Ignacio
Bought by
Colton Jamie L
Purchase Details
Closed on
Feb 9, 1993
Sold by
Vangreenby Donald M
Bought by
Dracut Dry Wall Inc
Create a Home Valuation Report for This Property
The Home Valuation Report is an in-depth analysis detailing your home's value as well as a comparison with similar homes in the area
Home Values in the Area
Average Home Value in this Area
Purchase History
| Date | Buyer | Sale Price | Title Company |
|---|---|---|---|
| Fryns Paul R | $315,000 | -- | |
| White Thomas J | $205,000 | -- | |
| Fhlmc | $243,583 | -- | |
| Fhlmc | $243,583 | -- | |
| Demko Mathew R | -- | -- | |
| Demko Mathew R | -- | -- | |
| Colton Jamie L | $299,900 | -- | |
| Colton Jamie L | $299,900 | -- | |
| Dracut Dry Wall Inc | $30,000 | -- | |
| Dracut Dry Wall Inc | $30,000 | -- |
Source: Public Records
Mortgage History
| Date | Status | Borrower | Loan Amount |
|---|---|---|---|
| Open | Fryns Paul R | $252,000 | |
| Closed | Dracut Dry Wall Inc | $252,000 | |
| Previous Owner | Dracut Dry Wall Inc | $21,700 |
Source: Public Records
Tax History Compared to Growth
Tax History
| Year | Tax Paid | Tax Assessment Tax Assessment Total Assessment is a certain percentage of the fair market value that is determined by local assessors to be the total taxable value of land and additions on the property. | Land | Improvement |
|---|---|---|---|---|
| 2025 | $5,462 | $475,800 | $167,100 | $308,700 |
| 2024 | $5,536 | $464,800 | $156,100 | $308,700 |
| 2023 | $5,226 | $420,800 | $135,800 | $285,000 |
| 2022 | $4,744 | $373,800 | $123,400 | $250,400 |
| 2021 | $4,432 | $329,300 | $107,300 | $222,000 |
| 2020 | $4,162 | $311,500 | $93,800 | $217,700 |
| 2019 | $4,083 | $290,800 | $86,800 | $204,000 |
| 2018 | $3,634 | $262,700 | $82,700 | $180,000 |
| 2017 | $3,642 | $244,100 | $75,200 | $168,900 |
| 2016 | $3,672 | $242,200 | $73,300 | $168,900 |
| 2015 | $3,471 | $224,200 | $73,300 | $150,900 |
| 2013 | $3,388 | $225,700 | $85,800 | $139,900 |
Source: Public Records
Map
Nearby Homes
- 21 Vernon St
- 192 1st St
- 12 Fremont St
- 318 Andover St
- 100 Merrimack Ave Unit 91
- 100 Merrimack Ave Unit 124
- 94 1st St Unit 10
- 284 Beacon St
- 26 Luce St
- 8 Read St
- 139 Beech St
- 45 Luce St
- 27 4th St
- 15 Sharyn Cir
- 216 Nesmith St Unit 2
- 53 Fairmount St
- 16 Winding Ln
- 112 Fort Hill Ave
- 88 11th St
- 111 Draper St