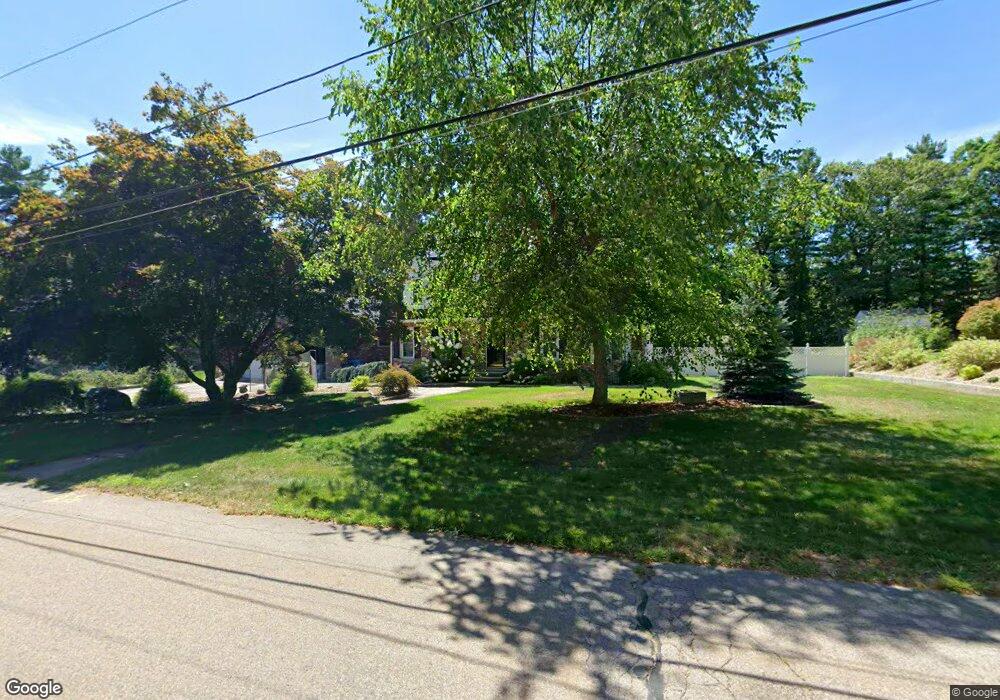
410 Bennett St Wrentham, MA 02093
Estimated Value: $721,000 - $859,772
4
Beds
3
Baths
2,810
Sq Ft
$288/Sq Ft
Est. Value
About This Home
This home is located at 410 Bennett St, Wrentham, MA 02093 and is currently estimated at $808,443, approximately $287 per square foot. 410 Bennett St is a home located in Norfolk County with nearby schools including Delaney Elementary School, Charles E Roderick, and Mercymount Country Day School.
Ownership History
Date
Name
Owned For
Owner Type
Purchase Details
Closed on
Jul 2, 2013
Sold by
Domenica James M and Domenica Doris M
Bought by
Pacella Christopher J and Pacella Lisa M
Current Estimated Value
Home Financials for this Owner
Home Financials are based on the most recent Mortgage that was taken out on this home.
Original Mortgage
$272,000
Outstanding Balance
$194,312
Interest Rate
3.51%
Mortgage Type
New Conventional
Estimated Equity
$614,131
Create a Home Valuation Report for This Property
The Home Valuation Report is an in-depth analysis detailing your home's value as well as a comparison with similar homes in the area
Home Values in the Area
Average Home Value in this Area
Purchase History
| Date | Buyer | Sale Price | Title Company |
|---|---|---|---|
| Pacella Christopher J | $340,000 | -- | |
| Pacella Christopher J | $340,000 | -- |
Source: Public Records
Mortgage History
| Date | Status | Borrower | Loan Amount |
|---|---|---|---|
| Open | Pacella Christopher J | $272,000 | |
| Closed | Pacella Christopher J | $272,000 |
Source: Public Records
Tax History Compared to Growth
Tax History
| Year | Tax Paid | Tax Assessment Tax Assessment Total Assessment is a certain percentage of the fair market value that is determined by local assessors to be the total taxable value of land and additions on the property. | Land | Improvement |
|---|---|---|---|---|
| 2025 | $8,330 | $718,700 | $302,100 | $416,600 |
| 2024 | $8,057 | $671,400 | $302,100 | $369,300 |
| 2023 | $8,192 | $649,100 | $274,500 | $374,600 |
| 2022 | $7,565 | $553,400 | $256,000 | $297,400 |
| 2021 | $7,257 | $515,800 | $223,400 | $292,400 |
| 2020 | $6,985 | $490,200 | $198,600 | $291,600 |
| 2019 | $6,922 | $490,200 | $198,600 | $291,600 |
| 2018 | $6,456 | $453,400 | $169,000 | $284,400 |
| 2017 | $6,308 | $442,700 | $165,800 | $276,900 |
| 2016 | $6,028 | $422,100 | $161,000 | $261,100 |
| 2015 | $5,932 | $396,000 | $154,700 | $241,300 |
| 2014 | $5,478 | $357,800 | $148,800 | $209,000 |
Source: Public Records
Map
Nearby Homes
- 50 Green St
- 791 South St Unit 5
- 80 Carriage House Ln
- 440 Chestnut St
- 1204 South St
- 1222 South St
- Lot 1 - Blueberry 2 Car Plan at King Philip Estates
- Lot 8 - Blueberry 2 Car Plan at King Philip Estates
- Lot 5 - Hughes 2 car Plan at King Philip Estates
- Lot 6 - Blueberry 3 Car Plan at King Philip Estates
- Lot 2 - Camden 2 Car Plan at King Philip Estates
- Lot 7 - Cedar Plan at King Philip Estates
- Lot 4 - Hemingway 2 Car Plan at King Philip Estates
- Lot 3 - Blueberry 2 Car Plan at King Philip Estates
- Lot 3 - 14 Earle Stewart Ln
- 11 Earle Stewart Ln
- 955 Summer St
- 4 Munroe Dr
- 19 Chestnut Lot 0
- 131 Creek St Unit 7