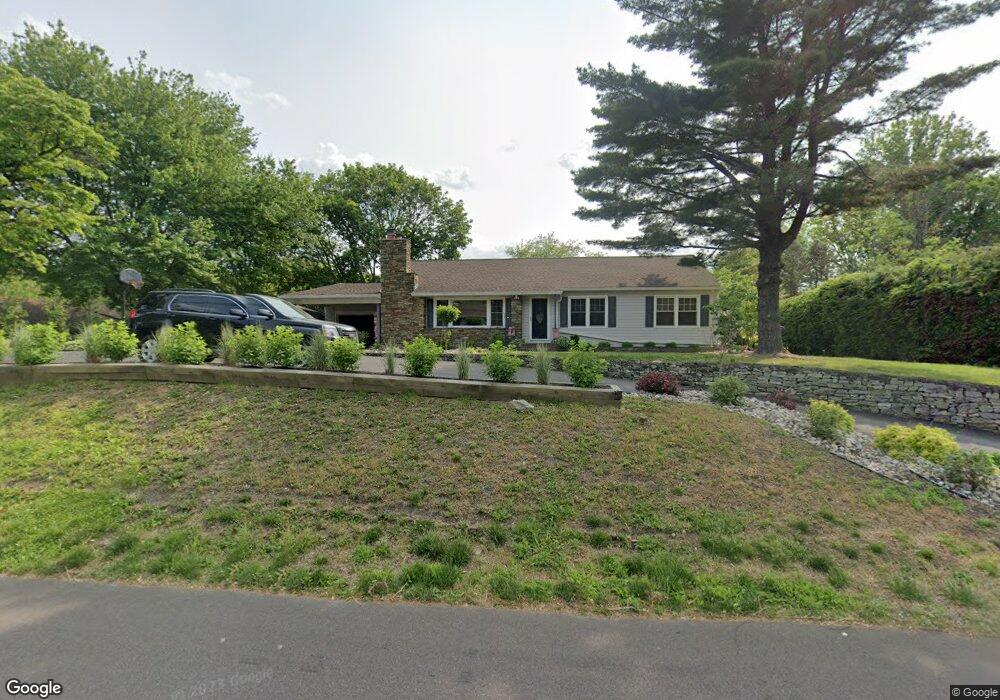
410 Byberry Rd Huntingdon Valley, PA 19006
Lower Moreland NeighborhoodEstimated Value: $455,337 - $600,000
3
Beds
3
Baths
1,360
Sq Ft
$398/Sq Ft
Est. Value
About This Home
This home is located at 410 Byberry Rd, Huntingdon Valley, PA 19006 and is currently estimated at $541,334, approximately $398 per square foot. 410 Byberry Rd is a home located in Montgomery County with nearby schools including Pine Road Elementary School, Murray Avenue School, and Lower Moreland High School.
Ownership History
Date
Name
Owned For
Owner Type
Purchase Details
Closed on
Dec 12, 2017
Sold by
Levi Dani and Levi Natalie
Bought by
Mavroudis George
Current Estimated Value
Home Financials for this Owner
Home Financials are based on the most recent Mortgage that was taken out on this home.
Original Mortgage
$340,622
Outstanding Balance
$286,774
Interest Rate
3.94%
Mortgage Type
New Conventional
Estimated Equity
$254,560
Purchase Details
Closed on
Mar 25, 2009
Sold by
Sikora Scott R
Bought by
Levi Dani and Levi Natalie
Home Financials for this Owner
Home Financials are based on the most recent Mortgage that was taken out on this home.
Original Mortgage
$210,000
Interest Rate
4.94%
Purchase Details
Closed on
Apr 8, 2008
Sold by
Countrywide Home Ln Ser Lp
Bought by
Sikora Scott R
Purchase Details
Closed on
May 7, 2007
Sold by
Lyons Sheryl and Lyons Brett
Bought by
Wells Fargo Bank Na
Purchase Details
Closed on
Jul 30, 1999
Sold by
Griffiths Griffith J and Griffiths Alverna E
Bought by
Lyons Brett and Lyons Sheryl
Create a Home Valuation Report for This Property
The Home Valuation Report is an in-depth analysis detailing your home's value as well as a comparison with similar homes in the area
Home Values in the Area
Average Home Value in this Area
Purchase History
| Date | Buyer | Sale Price | Title Company |
|---|---|---|---|
| Mavroudis George | $358,550 | -- | |
| Levi Dani | $285,000 | None Available | |
| Sikora Scott R | $226,000 | None Available | |
| Wells Fargo Bank Na | $1,255 | None Available | |
| Lyons Brett | $173,000 | -- |
Source: Public Records
Mortgage History
| Date | Status | Borrower | Loan Amount |
|---|---|---|---|
| Open | Mavroudis George | $340,622 | |
| Previous Owner | Levi Dani | $210,000 |
Source: Public Records
Tax History Compared to Growth
Tax History
| Year | Tax Paid | Tax Assessment Tax Assessment Total Assessment is a certain percentage of the fair market value that is determined by local assessors to be the total taxable value of land and additions on the property. | Land | Improvement |
|---|---|---|---|---|
| 2025 | $7,304 | $144,690 | $63,520 | $81,170 |
| 2024 | $7,304 | $144,690 | $63,520 | $81,170 |
| 2023 | $6,981 | $144,690 | $63,520 | $81,170 |
| 2022 | $6,776 | $144,690 | $63,520 | $81,170 |
| 2021 | $6,637 | $144,690 | $63,520 | $81,170 |
| 2020 | $6,440 | $144,690 | $63,520 | $81,170 |
| 2019 | $6,344 | $144,690 | $63,520 | $81,170 |
| 2018 | $1,452 | $144,690 | $63,520 | $81,170 |
| 2017 | $5,983 | $144,690 | $63,520 | $81,170 |
| 2016 | $5,926 | $144,690 | $63,520 | $81,170 |
| 2015 | $5,568 | $144,690 | $63,520 | $81,170 |
| 2014 | $5,568 | $144,690 | $63,520 | $81,170 |
Source: Public Records
Map
Nearby Homes
- 3450 Woodward Rd
- 3574 Glen Way
- 260 Brae Bourn Rd
- 244 Coachlight Terrace
- 3636 Pine Rd
- 468 Long Ln
- 3860 Pine Rd
- Kensington Plan at Philmont 55+
- Villanova Plan at Philmont 55+
- 120 Woodland Rd
- 3567 Oriole Dr
- 3660 Spring Run Rd
- 3187 Leopold Ct
- 408 County Line Rd
- 3990 Berton Rd
- 3175 Kathy Ln
- 11169 Hendrix St
- 985 Milkweed Ln
- 21 Roy Ln
- 3750 Wheatsheaf Rd
- 416 Byberry Rd
- 3486 Brae Bourn Dr
- 3466 Brae Bourn Dr
- 3500 Brae Bourn Dr
- 403 Byberry Rd
- 424 Byberry Rd
- 421 Byberry Rd
- 3450 Brae Bourn Dr
- 3510 Brae Bourn Dr
- 3505 Glen Way
- 430 Byberry Rd
- 3440 Brae Bourn Dr
- 3485 Brae Bourn Dr
- 3499 Brae Bourn Dr
- 3465 Brae Bourn Dr
- 3522 Brae Bourn Dr
- 3511 Brae Bourn Dr
- 3439 Brae Bourn Dr
- 3517 Glen Way
- 368 Byberry Rd