
Seller's Agent in 2021
John Tarpley
Schwartz Realty, Inc.
(301) 335-4225
3 in this area
50 Total Sales
Estimated Value: $1,116,836 - $1,354,000
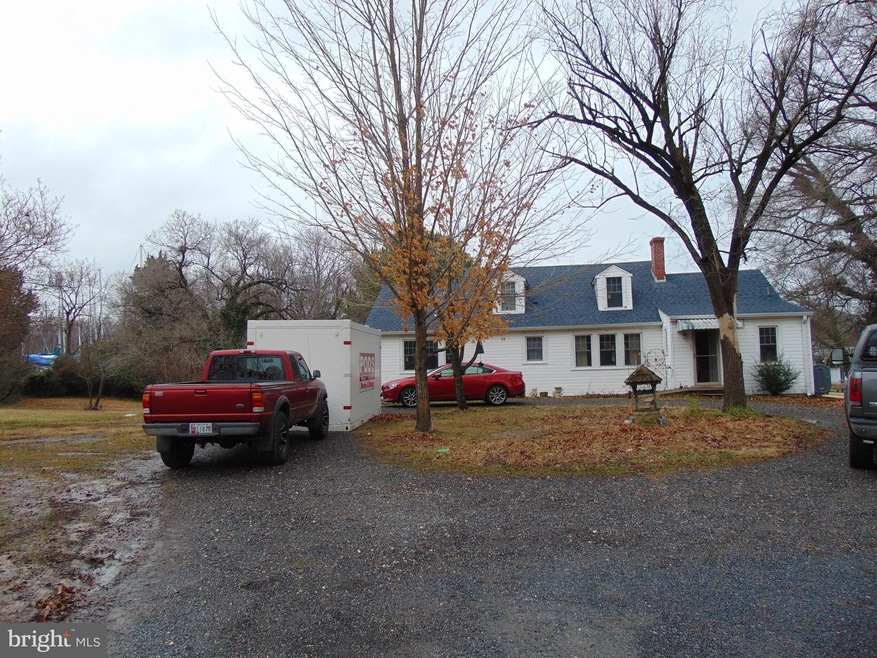
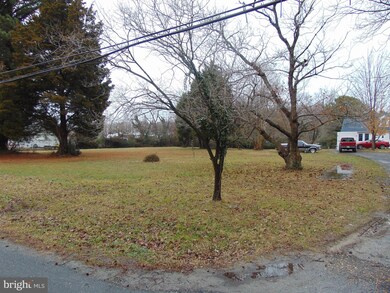
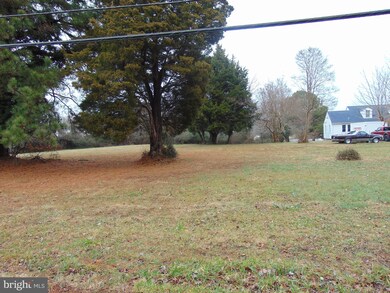
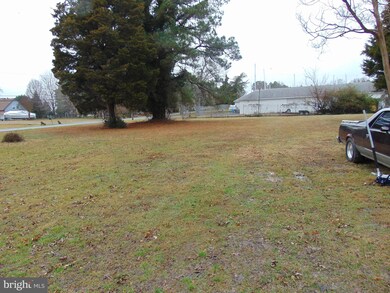
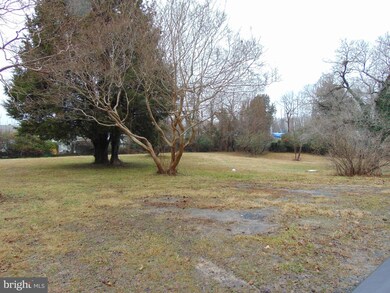
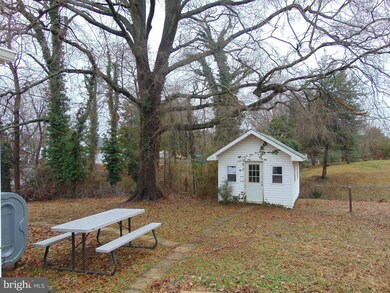
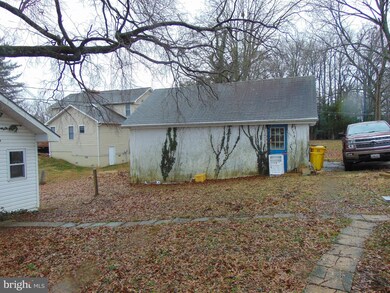
Up for sale to the public for the first time ever!!!! This 1.92 acre , 2 parcels of land with a section zoned W2 with a 162 feet of road footage. "See plat". 169 feet of water frontage with a 200 foot pier with 9 slips and power. Pier has large storage shed with power and freezer for bait. Existing home is being sold in "As-in" condition, but is very livable and could be remodel or torn down and build your own dream home. Existing home has hardwood floors lots of hand made molding and 1940 beach cottage charm that is worth saving. Sellers grand father built the home from the ground up. There are two other structures on the property. One is a two car garage and the other is a large storage shed with power. W2 - Light Industrial DistrictThis District is generally for those more traditional industrial uses exhibiting some nuisance characteristics. Offices and light manufacturing (secondary processing) are permitted as well as building materials storage and sales, self storage, and contractors and construction yards. Maximum lot coverage by structures and parking is 80%. Maximum height is 60 feet based on minimum setbacks and can increase to 87 feet provided setbacks are increased as per formula.
Last Agent to Sell the Property
(301) 335-4225 jtarpley59@comcast.net Schwartz Realty, Inc. Listed on: 01/07/2019
| Date | Buyer | Sale Price | Title Company |
|---|---|---|---|
| Howard Joseph Patrick | $919,085 | Universal Title | |
| Rogers Gingell R | -- | None Available | |
| Gingell R Kenneth | -- | None Available | |
| Gingell Angela N | -- | -- |
| Date | Status | Borrower | Loan Amount |
|---|---|---|---|
| Open | Howard Joseph Patrick | $919,085 |
| Date | Event | Price | List to Sale | Price per Sq Ft |
|---|---|---|---|---|
| 09/24/2021 09/24/21 | Sold | $919,085 | -6.2% | $539 / Sq Ft |
| 05/01/2021 05/01/21 | Price Changed | $980,000 | -8.8% | $575 / Sq Ft |
| 02/09/2021 02/09/21 | Price Changed | $1,075,000 | -2.3% | $631 / Sq Ft |
| 02/01/2021 02/01/21 | For Sale | $1,100,000 | +19.7% | $646 / Sq Ft |
| 01/31/2021 01/31/21 | Off Market | $919,085 | -- | -- |
| 11/11/2020 11/11/20 | Price Changed | $1,100,000 | -8.3% | $646 / Sq Ft |
| 10/20/2020 10/20/20 | Price Changed | $1,199,000 | -7.1% | $704 / Sq Ft |
| 09/10/2020 09/10/20 | Price Changed | $1,290,000 | -7.2% | $757 / Sq Ft |
| 08/23/2020 08/23/20 | Price Changed | $1,390,000 | -5.4% | $816 / Sq Ft |
| 07/07/2020 07/07/20 | Price Changed | $1,470,000 | -0.3% | $863 / Sq Ft |
| 04/30/2020 04/30/20 | Price Changed | $1,475,000 | 0.0% | $866 / Sq Ft |
| 04/30/2020 04/30/20 | For Sale | $1,475,000 | +60.5% | $866 / Sq Ft |
| 03/01/2020 03/01/20 | Off Market | $919,085 | -- | -- |
| 12/12/2019 12/12/19 | Price Changed | $1,500,000 | -3.2% | $880 / Sq Ft |
| 12/05/2019 12/05/19 | Price Changed | $1,550,000 | -6.1% | $910 / Sq Ft |
| 12/02/2019 12/02/19 | Price Changed | $1,650,000 | -2.9% | $968 / Sq Ft |
| 11/10/2019 11/10/19 | Price Changed | $1,700,000 | -1.4% | $998 / Sq Ft |
| 10/21/2019 10/21/19 | Price Changed | $1,725,000 | -1.4% | $1,012 / Sq Ft |
| 09/23/2019 09/23/19 | Price Changed | $1,750,000 | -2.8% | $1,027 / Sq Ft |
| 09/06/2019 09/06/19 | Price Changed | $1,800,000 | -1.4% | $1,056 / Sq Ft |
| 07/18/2019 07/18/19 | Price Changed | $1,825,000 | -1.4% | $1,071 / Sq Ft |
| 06/28/2019 06/28/19 | Price Changed | $1,850,000 | -2.6% | $1,086 / Sq Ft |
| 05/13/2019 05/13/19 | Price Changed | $1,900,000 | -99.0% | $1,115 / Sq Ft |
| 05/13/2019 05/13/19 | Price Changed | $190,000,000 | +9423.8% | $111,502 / Sq Ft |
| 05/03/2019 05/03/19 | Price Changed | $1,994,999 | -0.3% | $1,171 / Sq Ft |
| 01/07/2019 01/07/19 | For Sale | $1,999,999 | -- | $1,174 / Sq Ft |
| Year | Tax Paid | Tax Assessment Tax Assessment Total Assessment is a certain percentage of the fair market value that is determined by local assessors to be the total taxable value of land and additions on the property. | Land | Improvement |
|---|---|---|---|---|
| 2025 | $502 | $921,733 | -- | -- |
| 2024 | $502 | $861,567 | $0 | $0 |
| 2023 | $474 | $801,400 | $649,900 | $151,500 |
| 2022 | $430 | $791,900 | $0 | $0 |
| 2021 | $17,213 | $782,400 | $0 | $0 |
| 2020 | $8,453 | $772,900 | $649,900 | $123,000 |
| 2019 | $16,603 | $756,933 | $0 | $0 |
| 2018 | $7,513 | $740,967 | $0 | $0 |
| 2017 | $5,129 | $725,000 | $0 | $0 |
| 2016 | -- | $725,000 | $0 | $0 |
| 2015 | -- | $725,000 | $0 | $0 |
| 2014 | -- | $746,700 | $0 | $0 |
Seller's Agent in 2021
John Tarpley
Schwartz Realty, Inc.
(301) 335-4225
3 in this area
50 Total Sales
Buyer's Agent in 2021
James Fegan
RE/MAX
(410) 353-0956
13 in this area
88 Total Sales
Source: Bright MLS
MLS Number: MDAA302386
APN: 01-000-02924550
Disclaimer: Certain information contained herein is derived from information provided by parties other than Homes.com. All information provided is deemed reliable, but is not guaranteed to be accurate and should be independently verified.
![]() The data relating to real estate for sale on this website appears in part through the BRIGHT Internet Data Exchange program, a voluntary cooperative exchange of property listing data between licensed real estate brokerage firms, and is provided by BRIGHT through a licensing agreement.
The data relating to real estate for sale on this website appears in part through the BRIGHT Internet Data Exchange program, a voluntary cooperative exchange of property listing data between licensed real estate brokerage firms, and is provided by BRIGHT through a licensing agreement.
Listing information is from various brokers who participate in the Bright MLS IDX program and not all listings may be visible on the site.
The property information being provided on or through the website is for the personal, non-commercial use of consumers and such information may not be used for any purpose other than to identify prospective properties consumers may be interested in purchasing.
Some properties which appear for sale on the website may no longer be available because they are for instance, under contract, sold or are no longer being offered for sale.
Property information displayed is deemed reliable but is not guaranteed.
Copyright 2025 Bright MLS, Inc.