Estimated Value: $257,000 - $269,000
3
Beds
2
Baths
1,404
Sq Ft
$188/Sq Ft
Est. Value
About This Home
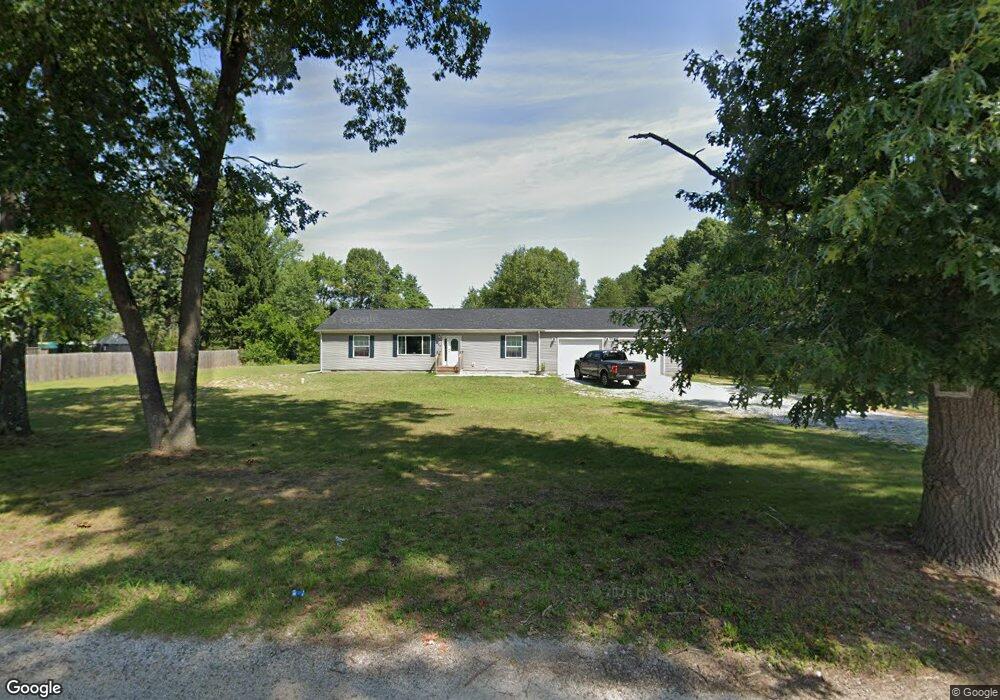
This home is located at 4106 E 150 N, Knox, IN 46534 and is currently estimated at $263,792, approximately $187 per square foot. 4106 E 150 N is a home with nearby schools including Knox Community Elementary School, Knox Community Middle School, and Knox Community High School.
Ownership History
Date
Name
Owned For
Owner Type
Purchase Details
Closed on
Nov 22, 2019
Sold by
More & More Home Builders Llc
Bought by
Williams Shauna B and Williams Cody A
Current Estimated Value
Home Financials for this Owner
Home Financials are based on the most recent Mortgage that was taken out on this home.
Original Mortgage
$144,703
Outstanding Balance
$133,093
Interest Rate
3.6%
Mortgage Type
USDA
Estimated Equity
$130,699
Purchase Details
Closed on
Jul 1, 2019
Sold by
Hensley Juanita
Bought by
More & More Home Builders Llc
Purchase Details
Closed on
Jun 19, 2019
Sold by
Hensley Curtis
Bought by
More & More Home Builders Llc
Purchase Details
Closed on
Dec 31, 2009
Sold by
Johnson James W and Johnson Jerome C
Bought by
Hensley Curtis and Hensley Juanita
Create a Home Valuation Report for This Property
The Home Valuation Report is an in-depth analysis detailing your home's value as well as a comparison with similar homes in the area
Home Values in the Area
Average Home Value in this Area
Purchase History
| Date | Buyer | Sale Price | Title Company |
|---|---|---|---|
| Williams Shauna B | -- | Meridian Title Corp | |
| More & More Home Builders Llc | $15,450 | Meridian Title Corporation | |
| More & More Home Builders Llc | $15,450 | Meridian Title Corp | |
| Hensley Curtis | $25,000 | Starke County Abstract Inc | |
| Hensley Curtis | -- | None Available |
Source: Public Records
Mortgage History
| Date | Status | Borrower | Loan Amount |
|---|---|---|---|
| Open | Williams Shauna B | $144,703 |
Source: Public Records
Tax History Compared to Growth
Tax History
| Year | Tax Paid | Tax Assessment Tax Assessment Total Assessment is a certain percentage of the fair market value that is determined by local assessors to be the total taxable value of land and additions on the property. | Land | Improvement |
|---|---|---|---|---|
| 2024 | $1,726 | $224,400 | $22,400 | $202,000 |
| 2023 | $1,718 | $202,900 | $20,100 | $182,800 |
| 2022 | $1,266 | $177,300 | $18,600 | $158,700 |
| 2021 | $874 | $128,800 | $18,300 | $110,500 |
| 2020 | $1,109 | $115,100 | $18,300 | $96,800 |
| 2019 | $239 | $13,200 | $13,200 | $0 |
| 2018 | $234 | $11,200 | $11,200 | $0 |
| 2017 | $227 | $11,200 | $11,200 | $0 |
| 2016 | $235 | $11,200 | $11,200 | $0 |
| 2014 | $212 | $11,700 | $11,700 | $0 |
| 2013 | $205 | $11,700 | $11,700 | $0 |
Source: Public Records
Map
Nearby Homes