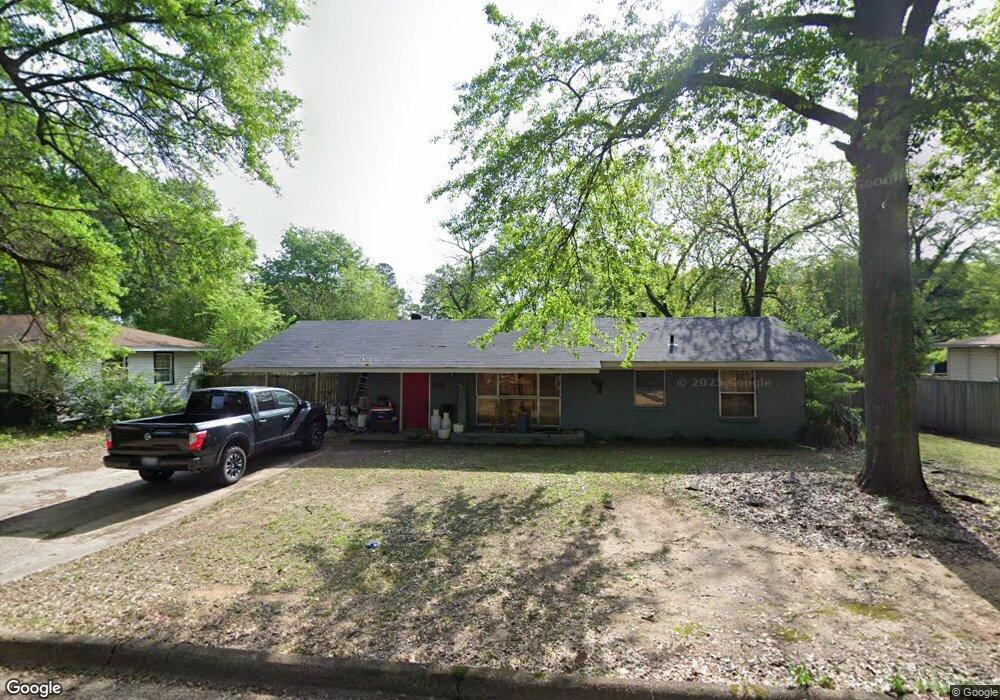
4106 Elizabeth St Texarkana, TX 75503
Estimated Value: $121,803 - $147,000
3
Beds
1
Bath
1,100
Sq Ft
$121/Sq Ft
Est. Value
About This Home
This home is located at 4106 Elizabeth St, Texarkana, TX 75503 and is currently estimated at $133,451, approximately $121 per square foot. 4106 Elizabeth St is a home located in Bowie County with nearby schools including Spring Lake Park Elementary School, Texas Middle School, and Texas High School.
Ownership History
Date
Name
Owned For
Owner Type
Purchase Details
Closed on
Jan 13, 2017
Sold by
Drake Marcus and Drake Felicia
Bought by
Yates Nicholas and Juanes Ana L
Current Estimated Value
Home Financials for this Owner
Home Financials are based on the most recent Mortgage that was taken out on this home.
Original Mortgage
$88,271
Outstanding Balance
$72,660
Interest Rate
4.08%
Mortgage Type
FHA
Estimated Equity
$60,791
Purchase Details
Closed on
Jun 10, 2016
Sold by
Secretary Of Hud
Bought by
Drake Marcus
Home Financials for this Owner
Home Financials are based on the most recent Mortgage that was taken out on this home.
Original Mortgage
$54,950
Interest Rate
3.61%
Mortgage Type
Future Advance Clause Open End Mortgage
Purchase Details
Closed on
Jul 7, 2015
Sold by
Moore Joseph
Bought by
U S Bank N A
Create a Home Valuation Report for This Property
The Home Valuation Report is an in-depth analysis detailing your home's value as well as a comparison with similar homes in the area
Home Values in the Area
Average Home Value in this Area
Purchase History
| Date | Buyer | Sale Price | Title Company |
|---|---|---|---|
| Yates Nicholas | -- | Twin City Title Company | |
| Drake Marcus | -- | Twin City Title Company | |
| U S Bank N A | $88,674 | None Available |
Source: Public Records
Mortgage History
| Date | Status | Borrower | Loan Amount |
|---|---|---|---|
| Open | Yates Nicholas | $88,271 | |
| Previous Owner | Drake Marcus | $54,950 |
Source: Public Records
Tax History Compared to Growth
Tax History
| Year | Tax Paid | Tax Assessment Tax Assessment Total Assessment is a certain percentage of the fair market value that is determined by local assessors to be the total taxable value of land and additions on the property. | Land | Improvement |
|---|---|---|---|---|
| 2025 | $2,414 | $104,598 | $13,750 | $90,848 |
| 2024 | $2,414 | $101,960 | $13,750 | $88,210 |
| 2023 | $2,259 | $95,418 | $13,750 | $81,668 |
| 2022 | $1,859 | $77,894 | $12,600 | $65,294 |
| 2021 | $1,728 | $67,565 | $12,600 | $54,965 |
| 2020 | $1,670 | $64,945 | $12,600 | $52,345 |
| 2019 | $1,666 | $62,450 | $12,600 | $49,850 |
| 2018 | $1,615 | $60,528 | $12,600 | $47,928 |
| 2017 | $1,585 | $59,590 | $12,600 | $46,990 |
| 2016 | $1,625 | $61,095 | $12,600 | $48,495 |
| 2015 | $1,612 | $60,624 | $12,600 | $48,024 |
| 2014 | $1,612 | $62,318 | $12,600 | $49,718 |
Source: Public Records
Map
Nearby Homes
- 4110 Elizabeth St
- 4102 Elizabeth St
- 4105 Olive St
- 4114 Elizabeth St
- 4107 Olive St
- 4105 Elizabeth St
- 4107 Elizabeth St
- 4101 Elizabeth St
- 4101 Olive St
- 4109 Elizabeth St
- 4111 Olive St
- 4024 Elizabeth St
- 4116 Elizabeth St
- 4023 Olive St
- 4125 Olive St
- 4102 Olive St
- 4123 Elizabeth St
- 4022 Elizabeth St
- 4013 Elizabeth St
- 4104 Olive St