411 E 31st St South Sioux City, NE 68776
Estimated Value: $221,000 - $244,000
3
Beds
2
Baths
1,680
Sq Ft
$136/Sq Ft
Est. Value
About This Home
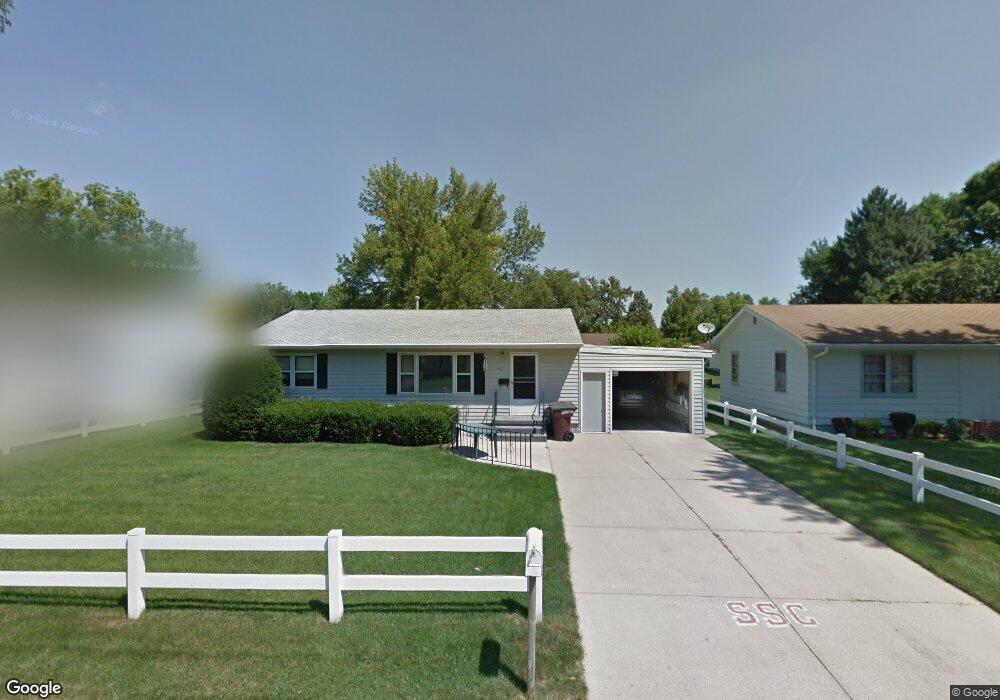
This home is located at 411 E 31st St, South Sioux City, NE 68776 and is currently estimated at $227,679, approximately $135 per square foot. 411 E 31st St is a home located in Dakota County with nearby schools including Cardinal Elementary School, South Sioux City Middle School, and South Sioux Senior High School.
Ownership History
Date
Name
Owned For
Owner Type
Purchase Details
Closed on
May 21, 2014
Sold by
Dunn Robert L
Bought by
Alvarez Ernesto Alvarez and Magana Abigail
Current Estimated Value
Home Financials for this Owner
Home Financials are based on the most recent Mortgage that was taken out on this home.
Original Mortgage
$84,000
Outstanding Balance
$25,792
Interest Rate
4.32%
Mortgage Type
New Conventional
Estimated Equity
$201,887
Create a Home Valuation Report for This Property
The Home Valuation Report is an in-depth analysis detailing your home's value as well as a comparison with similar homes in the area
Home Values in the Area
Average Home Value in this Area
Purchase History
| Date | Buyer | Sale Price | Title Company |
|---|---|---|---|
| Alvarez Ernesto Alvarez | $105,000 | Lewis & Clark Title |
Source: Public Records
Mortgage History
| Date | Status | Borrower | Loan Amount |
|---|---|---|---|
| Open | Alvarez Ernesto Alvarez | $84,000 |
Source: Public Records
Tax History Compared to Growth
Tax History
| Year | Tax Paid | Tax Assessment Tax Assessment Total Assessment is a certain percentage of the fair market value that is determined by local assessors to be the total taxable value of land and additions on the property. | Land | Improvement |
|---|---|---|---|---|
| 2024 | $2,331 | $178,075 | $21,940 | $156,135 |
| 2023 | $2,788 | $157,015 | $18,535 | $138,480 |
| 2022 | $2,858 | $149,465 | $18,535 | $130,930 |
| 2021 | $2,727 | $137,560 | $18,535 | $119,025 |
| 2020 | $2,463 | $123,215 | $18,535 | $104,680 |
| 2019 | $2,357 | $117,560 | $18,535 | $99,025 |
| 2018 | $2,351 | $116,310 | $20,700 | $95,610 |
| 2017 | $2,073 | $102,780 | $20,700 | $82,080 |
| 2016 | $1,741 | $87,785 | $20,700 | $67,085 |
| 2014 | $1,841 | $89,410 | $19,125 | $70,285 |
Source: Public Records
Map
Nearby Homes