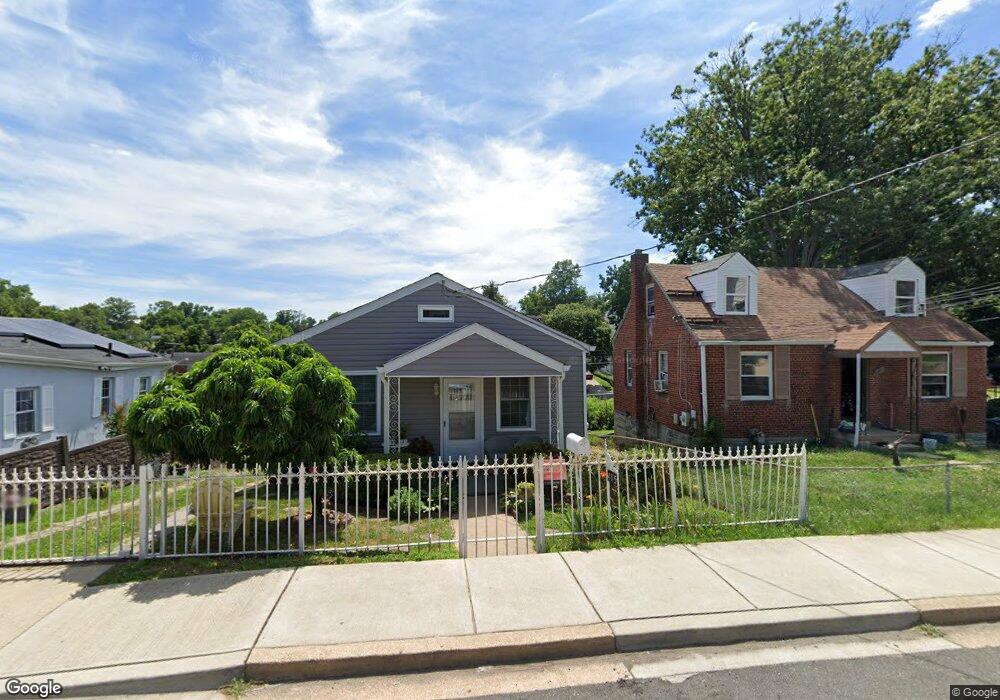
4115 Torque St Capitol Heights, MD 20743
Estimated Value: $224,000 - $296,000
--
Bed
1
Bath
1,008
Sq Ft
$274/Sq Ft
Est. Value
About This Home
This home is located at 4115 Torque St, Capitol Heights, MD 20743 and is currently estimated at $276,544, approximately $274 per square foot. 4115 Torque St is a home located in Prince George's County with nearby schools including Bradbury Heights Elementary School, Drew Freeman Middle School, and Suitland High School.
Ownership History
Date
Name
Owned For
Owner Type
Purchase Details
Closed on
Apr 10, 2007
Sold by
Cooper Gwendolyn
Bought by
Barrera Hary
Current Estimated Value
Home Financials for this Owner
Home Financials are based on the most recent Mortgage that was taken out on this home.
Original Mortgage
$175,000
Outstanding Balance
$144,353
Interest Rate
6.52%
Mortgage Type
Purchase Money Mortgage
Estimated Equity
$132,191
Purchase Details
Closed on
Mar 28, 2007
Sold by
Cooper Gwendolyn
Bought by
Barrera Hary
Home Financials for this Owner
Home Financials are based on the most recent Mortgage that was taken out on this home.
Original Mortgage
$175,000
Outstanding Balance
$144,353
Interest Rate
6.52%
Mortgage Type
Purchase Money Mortgage
Estimated Equity
$132,191
Purchase Details
Closed on
Mar 18, 1997
Sold by
Ekee Emmanuel
Bought by
Cooper Gwendolyn
Purchase Details
Closed on
Oct 23, 1996
Sold by
Smith Odell A
Bought by
Ekee Emmanuel
Create a Home Valuation Report for This Property
The Home Valuation Report is an in-depth analysis detailing your home's value as well as a comparison with similar homes in the area
Home Values in the Area
Average Home Value in this Area
Purchase History
| Date | Buyer | Sale Price | Title Company |
|---|---|---|---|
| Barrera Hary | $175,000 | -- | |
| Barrera Hary | $175,000 | -- | |
| Cooper Gwendolyn | $79,000 | -- | |
| Ekee Emmanuel | $60,500 | -- |
Source: Public Records
Mortgage History
| Date | Status | Borrower | Loan Amount |
|---|---|---|---|
| Open | Barrera Hary | $175,000 | |
| Closed | Barrera Hary | $175,000 |
Source: Public Records
Tax History Compared to Growth
Tax History
| Year | Tax Paid | Tax Assessment Tax Assessment Total Assessment is a certain percentage of the fair market value that is determined by local assessors to be the total taxable value of land and additions on the property. | Land | Improvement |
|---|---|---|---|---|
| 2025 | $3,647 | $242,700 | -- | -- |
| 2024 | $3,647 | $218,600 | $0 | $0 |
| 2023 | $3,288 | $194,500 | $60,000 | $134,500 |
| 2022 | $2,059 | $185,200 | $0 | $0 |
| 2021 | $6,162 | $175,900 | $0 | $0 |
| 2020 | $3,327 | $166,600 | $45,000 | $121,600 |
| 2019 | $2,215 | $154,700 | $0 | $0 |
| 2018 | $2,431 | $142,800 | $0 | $0 |
| 2017 | $1,904 | $130,900 | $0 | $0 |
| 2016 | -- | $126,733 | $0 | $0 |
| 2015 | $2,662 | $122,567 | $0 | $0 |
| 2014 | $2,662 | $118,400 | $0 | $0 |
Source: Public Records
Map
Nearby Homes
- 4336 Southern Ave SE
- 4320 Burns St SE
- 4203 Shell St
- 4012 Will St
- 4308 Alabama Ave SE
- 4304 Torque St
- 4017 Alton St
- 4223 Vine St
- 4104 Byers St
- 1227 44th Place SE
- 4442 Alabama Ave SE
- 4227 Nash St SE
- 1208 44th Place SE
- 4619 Southern Ave
- 4712 Southern Ave SE
- 4238 Southern Ave SE
- 1405 42nd St SE
- 4212 Byers St
- 4224 Southern Ave SE
- 1135 46th St SE