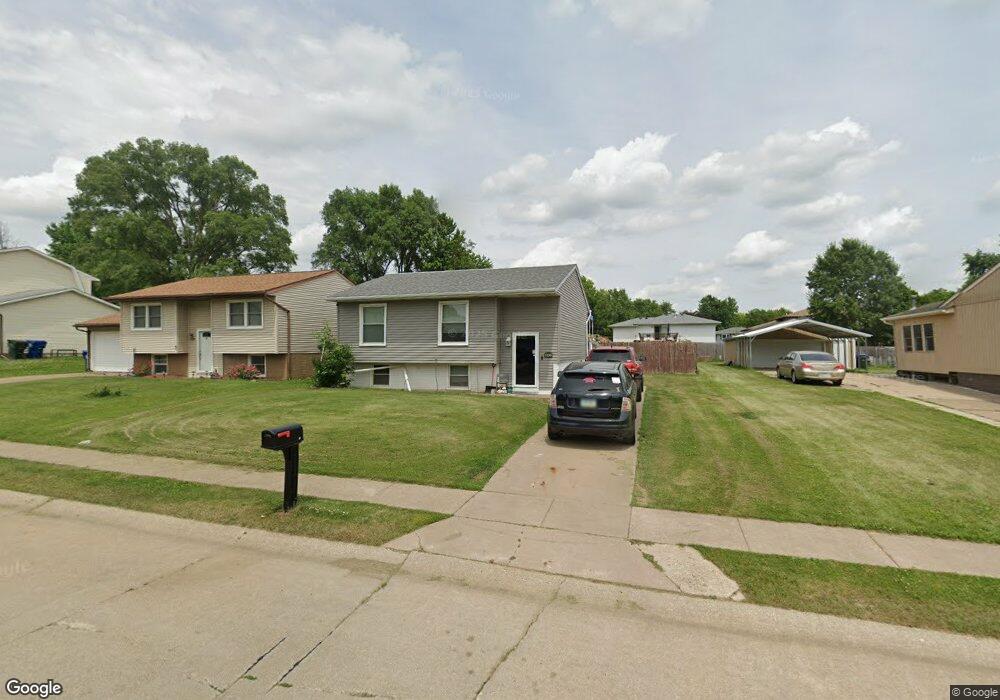
4117 N Elsie Ave Davenport, IA 52806
North Side NeighborhoodEstimated Value: $117,000 - $173,000
2
Beds
2
Baths
826
Sq Ft
$167/Sq Ft
Est. Value
About This Home
This home is located at 4117 N Elsie Ave, Davenport, IA 52806 and is currently estimated at $138,299, approximately $167 per square foot. 4117 N Elsie Ave is a home located in Scott County with nearby schools including Tygart Creek Elementary School, Buchanan Elementary School, and Christian County Day Treatment Center Alt.
Ownership History
Date
Name
Owned For
Owner Type
Purchase Details
Closed on
Jul 17, 2024
Sold by
Hogle Jeffery and Hogle Tammy
Bought by
Murphey Rashell
Current Estimated Value
Home Financials for this Owner
Home Financials are based on the most recent Mortgage that was taken out on this home.
Original Mortgage
$103,098
Outstanding Balance
$101,857
Interest Rate
6.95%
Mortgage Type
FHA
Estimated Equity
$36,442
Purchase Details
Closed on
Jun 12, 2020
Sold by
First Financial Group Lc
Bought by
Hogle Jeffery and Hogle Tammy
Home Financials for this Owner
Home Financials are based on the most recent Mortgage that was taken out on this home.
Original Mortgage
$92,975
Interest Rate
3.2%
Mortgage Type
New Conventional
Purchase Details
Closed on
Jan 6, 2015
Sold by
Griffin Latonya N
Bought by
First Financial Group Lc
Purchase Details
Closed on
Jan 5, 2005
Sold by
Alicic Adil and Alicic Fatima
Bought by
Griffin Latonya
Home Financials for this Owner
Home Financials are based on the most recent Mortgage that was taken out on this home.
Original Mortgage
$81,619
Interest Rate
5.83%
Mortgage Type
FHA
Create a Home Valuation Report for This Property
The Home Valuation Report is an in-depth analysis detailing your home's value as well as a comparison with similar homes in the area
Home Values in the Area
Average Home Value in this Area
Purchase History
| Date | Buyer | Sale Price | Title Company |
|---|---|---|---|
| Murphey Rashell | $105,000 | None Listed On Document | |
| Hogle Jeffery | $98,000 | None Available | |
| First Financial Group Lc | $38,986 | None Available | |
| Griffin Latonya | $83,000 | None Available |
Source: Public Records
Mortgage History
| Date | Status | Borrower | Loan Amount |
|---|---|---|---|
| Open | Murphey Rashell | $103,098 | |
| Previous Owner | Hogle Jeffery | $92,975 | |
| Previous Owner | Griffin Latonya | $81,619 |
Source: Public Records
Tax History Compared to Growth
Tax History
| Year | Tax Paid | Tax Assessment Tax Assessment Total Assessment is a certain percentage of the fair market value that is determined by local assessors to be the total taxable value of land and additions on the property. | Land | Improvement |
|---|---|---|---|---|
| 2025 | $2,140 | $134,380 | $24,990 | $109,390 |
| 2024 | $2,084 | $130,000 | $24,990 | $105,010 |
| 2023 | $2,110 | $130,000 | $24,990 | $105,010 |
| 2022 | $2,118 | $107,660 | $20,580 | $87,080 |
| 2021 | $2,118 | $107,660 | $20,580 | $87,080 |
| 2020 | $2,244 | $103,310 | $20,580 | $82,730 |
| 2019 | $2,318 | $103,310 | $20,580 | $82,730 |
| 2018 | $2,268 | $103,310 | $20,580 | $82,730 |
| 2017 | $575 | $103,310 | $20,580 | $82,730 |
| 2016 | $2,262 | $103,310 | $0 | $0 |
| 2015 | $2,262 | $99,950 | $0 | $0 |
| 2014 | $2,026 | $99,950 | $0 | $0 |
| 2013 | $1,986 | $0 | $0 | $0 |
| 2012 | -- | $85,640 | $18,420 | $67,220 |
Source: Public Records
Map
Nearby Homes
- 3932 N Elsie Ave
- 3325 Covington Dr
- 4325 N Michigan Ave
- 4036 Hillandale Rd
- 4413 N Michigan Ave
- 4425 N Michigan Ave
- 3705 W 46th St
- 3208 W 47th Place
- 4504 N Gayman Ave
- 2728 W 38th Place
- 3313 W 48th Place
- 2724 W 38th Place
- 3112 W 34th St
- 3812 N Thornwood Ave
- 4849 Oakwood Ct
- 2307 W 38th Place
- 4406 Regency Place
- 3536 Heatherton Dr
- 5311 N Fairmount St
- 0 W Kimberly Rd Unit RMAQC4269825
- 4109 N Elsie Ave
- 4125 N Elsie Ave
- 4103 N Elsie Ave
- 3105 W 43rd St
- 4131 N Elsie Ave
- 3109 W 43rd St
- 3101 W 43rd St
- 3115 W 43rd St
- 4137 N Elsie Ave
- 4021 N Elsie Ave
- 3121 W 43rd St
- 4112 N Elsie Ave
- 4118 N Elsie Ave
- 4128 N Elsie Ave
- 4001 Bedford Place
- 4106 N Elsie Ave
- 4126 N Elsie Ave
- 4143 N Elsie Ave
- 3127 W 43rd St
- 4013 N Elsie Ave