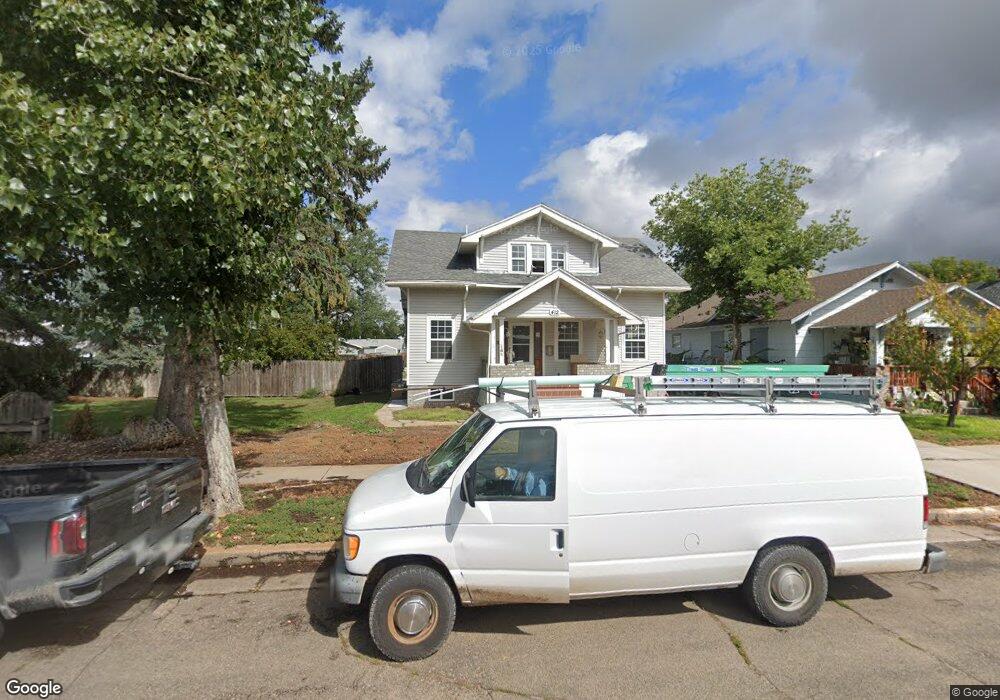
412 Beattie St Sterling, CO 80751
Estimated Value: $167,861 - $369,000
4
Beds
2
Baths
2,896
Sq Ft
$99/Sq Ft
Est. Value
About This Home
This home is located at 412 Beattie St, Sterling, CO 80751 and is currently estimated at $286,465, approximately $98 per square foot. 412 Beattie St is a home located in Logan County with nearby schools including Ayres Elementary School, Campbell Elementary School, and Sterling Middle School.
Ownership History
Date
Name
Owned For
Owner Type
Purchase Details
Closed on
Feb 24, 2025
Sold by
Carr Alisoan C Noisat and Carr Thomas Joseph
Bought by
Royboy Investments Llc
Current Estimated Value
Home Financials for this Owner
Home Financials are based on the most recent Mortgage that was taken out on this home.
Original Mortgage
$130,500
Outstanding Balance
$66,377
Interest Rate
6.93%
Mortgage Type
Construction
Estimated Equity
$220,088
Purchase Details
Closed on
Jan 20, 2015
Sold by
Grieger Pamela L
Bought by
Carr Thomas Joseph and Noisat Alison C
Home Financials for this Owner
Home Financials are based on the most recent Mortgage that was taken out on this home.
Original Mortgage
$165,306
Interest Rate
3.97%
Mortgage Type
New Conventional
Create a Home Valuation Report for This Property
The Home Valuation Report is an in-depth analysis detailing your home's value as well as a comparison with similar homes in the area
Home Values in the Area
Average Home Value in this Area
Purchase History
| Date | Buyer | Sale Price | Title Company |
|---|---|---|---|
| Royboy Investments Llc | $166,728 | None Listed On Document | |
| Carr Thomas Joseph | $162,000 | Stewart Title |
Source: Public Records
Mortgage History
| Date | Status | Borrower | Loan Amount |
|---|---|---|---|
| Open | Royboy Investments Llc | $130,500 | |
| Previous Owner | Carr Thomas Joseph | $165,306 |
Source: Public Records
Tax History Compared to Growth
Tax History
| Year | Tax Paid | Tax Assessment Tax Assessment Total Assessment is a certain percentage of the fair market value that is determined by local assessors to be the total taxable value of land and additions on the property. | Land | Improvement |
|---|---|---|---|---|
| 2024 | $1,150 | $18,770 | $0 | $0 |
| 2023 | $1,150 | $18,770 | $0 | $0 |
| 2022 | $1,253 | $14,870 | $3,390 | $11,480 |
| 2021 | $1,225 | $15,300 | $3,490 | $11,810 |
| 2020 | $1,205 | $28,620 | $3,290 | $25,330 |
| 2019 | $1,201 | $28,420 | $3,270 | $25,150 |
| 2018 | $1,058 | $12,500 | $2,460 | $10,040 |
| 2017 | $1,041 | $60,740 | $11,960 | $48,780 |
| 2015 | $590 | $55,540 | $11,100 | $44,440 |
| 2014 | $590 | $59,800 | $11,100 | $48,700 |
| 2013 | $590 | $59,800 | $11,100 | $48,700 |
Source: Public Records
Map
Nearby Homes