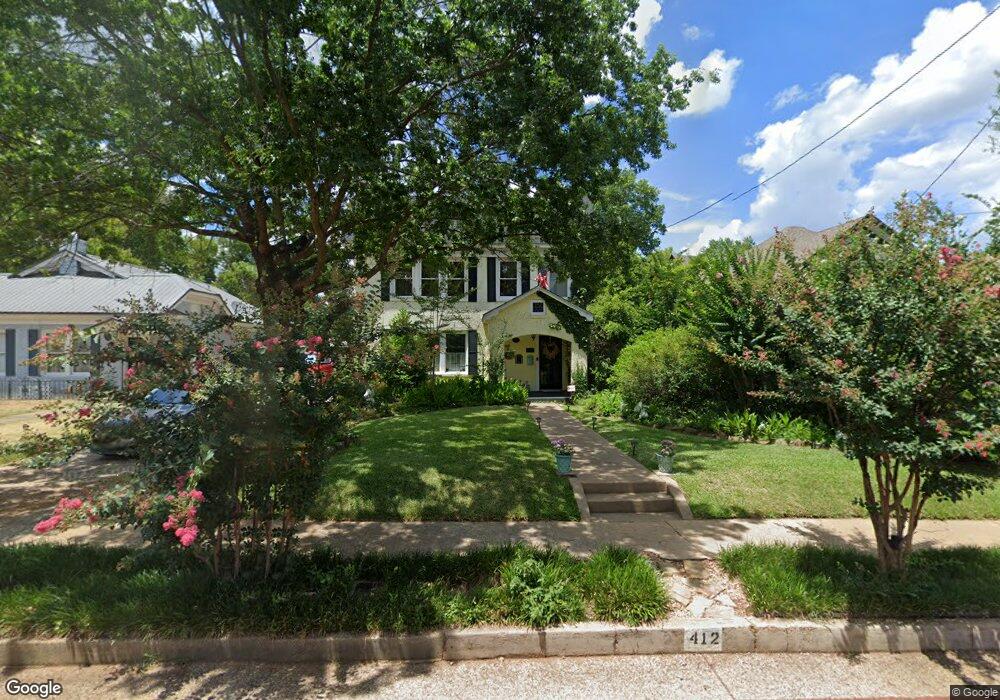
412 E Charnwood St Tyler, TX 75701
Charnwood District NeighborhoodEstimated Value: $335,000 - $480,000
--
Bed
2
Baths
3,276
Sq Ft
$132/Sq Ft
Est. Value
About This Home
This home is located at 412 E Charnwood St, Tyler, TX 75701 and is currently estimated at $431,429, approximately $131 per square foot. 412 E Charnwood St is a home located in Smith County with nearby schools including Bell Elementary School, Hogg Middle School, and Tyler Legacy High School.
Ownership History
Date
Name
Owned For
Owner Type
Purchase Details
Closed on
Mar 9, 2012
Sold by
Speedy Patrick Sam
Bought by
Walker Chris and Walker Sue
Current Estimated Value
Home Financials for this Owner
Home Financials are based on the most recent Mortgage that was taken out on this home.
Original Mortgage
$180,000
Outstanding Balance
$124,704
Interest Rate
4.05%
Mortgage Type
Purchase Money Mortgage
Estimated Equity
$306,725
Purchase Details
Closed on
Feb 17, 2012
Sold by
Speedy Casey Denise
Bought by
Speedy Patrick Sam
Home Financials for this Owner
Home Financials are based on the most recent Mortgage that was taken out on this home.
Original Mortgage
$180,000
Outstanding Balance
$124,704
Interest Rate
4.05%
Mortgage Type
Purchase Money Mortgage
Estimated Equity
$306,725
Create a Home Valuation Report for This Property
The Home Valuation Report is an in-depth analysis detailing your home's value as well as a comparison with similar homes in the area
Home Values in the Area
Average Home Value in this Area
Purchase History
| Date | Buyer | Sale Price | Title Company |
|---|---|---|---|
| Walker Chris | -- | Ctc | |
| Speedy Patrick Sam | -- | Ctc |
Source: Public Records
Mortgage History
| Date | Status | Borrower | Loan Amount |
|---|---|---|---|
| Open | Walker Chris | $180,000 |
Source: Public Records
Tax History Compared to Growth
Tax History
| Year | Tax Paid | Tax Assessment Tax Assessment Total Assessment is a certain percentage of the fair market value that is determined by local assessors to be the total taxable value of land and additions on the property. | Land | Improvement |
|---|---|---|---|---|
| 2024 | $3,814 | $283,897 | $33,450 | $406,350 |
| 2023 | $4,499 | $383,362 | $33,450 | $349,912 |
| 2022 | $4,597 | $315,696 | $22,300 | $293,396 |
| 2021 | $4,475 | $213,295 | $22,300 | $190,995 |
| 2020 | $4,325 | $202,121 | $22,300 | $179,821 |
| 2019 | $4,435 | $202,825 | $22,300 | $180,525 |
| 2018 | $4,330 | $199,094 | $22,300 | $176,794 |
| 2017 | $4,409 | $206,506 | $22,300 | $184,206 |
| 2016 | $4,298 | $201,306 | $22,300 | $179,006 |
| 2015 | $4,076 | $196,269 | $22,300 | $173,969 |
| 2014 | $4,076 | $191,825 | $22,300 | $169,525 |
Source: Public Records
Map
Nearby Homes
- 502 S Fannin Ave
- 735 S Donnybrook Ave
- 517 E Wells St
- 124 Rowland Place
- 128 Rowland Place
- 145 Rowland Place
- 201 W Rusk St
- 300 E Dodge St
- 428 S Bois d Arc Ave
- 309 E Dodge St
- 520 E Lake St
- 310 W Dobbs St
- 815 S Chilton Ave
- 841 S Chilton Ave
- 400 Lindsey Ln
- 13832 Luka Ln
- 2881 State Highway 110n Unit 69
- 114 E 2nd St
- 427 E Locust St
- 613 S Baxter Ave
- 406 E Charnwood St
- 416 E Charnwood St
- 617 617 Niblack Place
- 719 Niblack Place
- 617 Niblack Place
- 420 E Charnwood St
- 400 400 E Charnwood
- 400 E Charnwood St
- 522 S Donnybrook Ave
- 413 E Houston St
- 407 E Houston St
- 403 E Charnwood St
- 504 E Charnwood St
- 403 E Houston St
- 423 E Charnwood St
- 409 E Charnwood St
- 415 E Charnwood St
- 401 E Charnwood St
- 325 E Houston St
- 702 S Donnybrook Ave