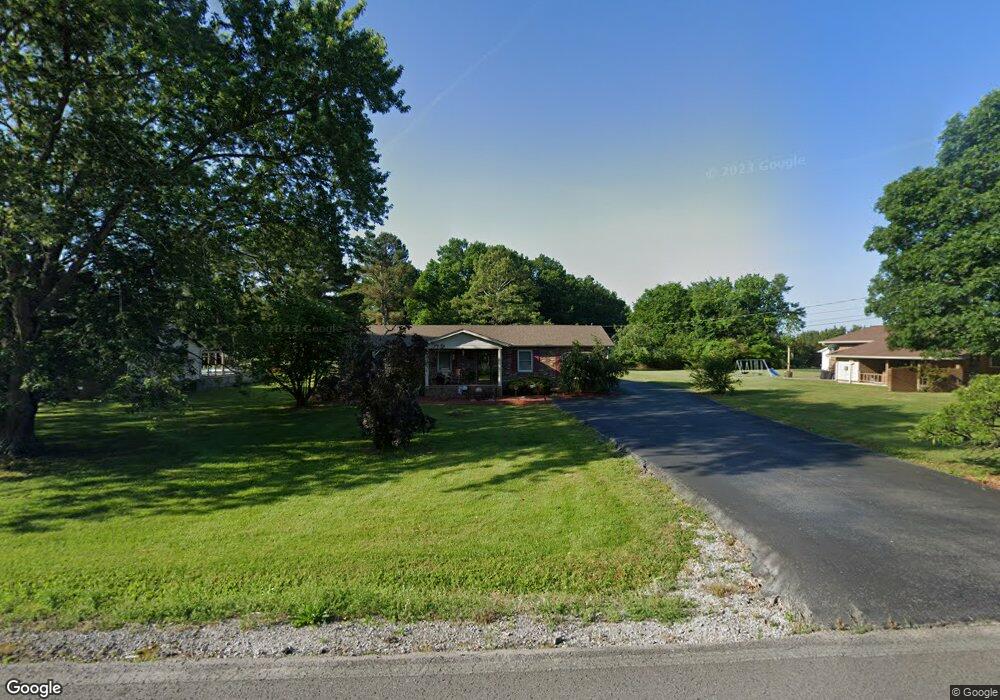
412 Narrows Rd Shelbyville, TN 37160
Estimated Value: $306,000 - $386,000
--
Bed
3
Baths
2,150
Sq Ft
$159/Sq Ft
Est. Value
About This Home
This home is located at 412 Narrows Rd, Shelbyville, TN 37160 and is currently estimated at $341,097, approximately $158 per square foot. 412 Narrows Rd is a home located in Bedford County with nearby schools including South Side Elementary School, Harris Middle School, and Shelbyville Central High School.
Ownership History
Date
Name
Owned For
Owner Type
Purchase Details
Closed on
Aug 14, 2007
Sold by
Bobo Frank
Bought by
Phillips Tim W
Current Estimated Value
Purchase Details
Closed on
Oct 6, 1997
Sold by
Swan Dennis W
Bought by
Phillips Timothy and Phillips Wanda
Home Financials for this Owner
Home Financials are based on the most recent Mortgage that was taken out on this home.
Original Mortgage
$75,500
Interest Rate
7.95%
Purchase Details
Closed on
May 15, 1987
Bought by
Swan Dennis W
Purchase Details
Closed on
Jun 26, 1986
Bought by
Nichols William T
Create a Home Valuation Report for This Property
The Home Valuation Report is an in-depth analysis detailing your home's value as well as a comparison with similar homes in the area
Home Values in the Area
Average Home Value in this Area
Purchase History
| Date | Buyer | Sale Price | Title Company |
|---|---|---|---|
| Phillips Tim W | $3,000 | -- | |
| Phillips Timothy | $130,000 | -- | |
| Swan Dennis W | $57,200 | -- | |
| Nichols William T | $57,000 | -- |
Source: Public Records
Mortgage History
| Date | Status | Borrower | Loan Amount |
|---|---|---|---|
| Previous Owner | Nichols William T | $75,500 |
Source: Public Records
Tax History Compared to Growth
Tax History
| Year | Tax Paid | Tax Assessment Tax Assessment Total Assessment is a certain percentage of the fair market value that is determined by local assessors to be the total taxable value of land and additions on the property. | Land | Improvement |
|---|---|---|---|---|
| 2025 | -- | $53,825 | $0 | $0 |
| 2024 | -- | $53,825 | $7,250 | $46,575 |
| 2023 | $2,049 | $53,825 | $7,250 | $46,575 |
| 2022 | $2,108 | $53,825 | $7,250 | $46,575 |
| 2021 | $1,914 | $53,825 | $7,250 | $46,575 |
| 2020 | $1,731 | $53,825 | $7,250 | $46,575 |
| 2019 | $1,731 | $39,075 | $4,500 | $34,575 |
| 2018 | $1,692 | $39,075 | $4,500 | $34,575 |
| 2017 | $1,692 | $39,075 | $4,500 | $34,575 |
| 2016 | $1,676 | $39,075 | $4,500 | $34,575 |
| 2015 | $1,676 | $39,075 | $4,500 | $34,575 |
| 2014 | $1,376 | $35,113 | $0 | $0 |
Source: Public Records
Map
Nearby Homes