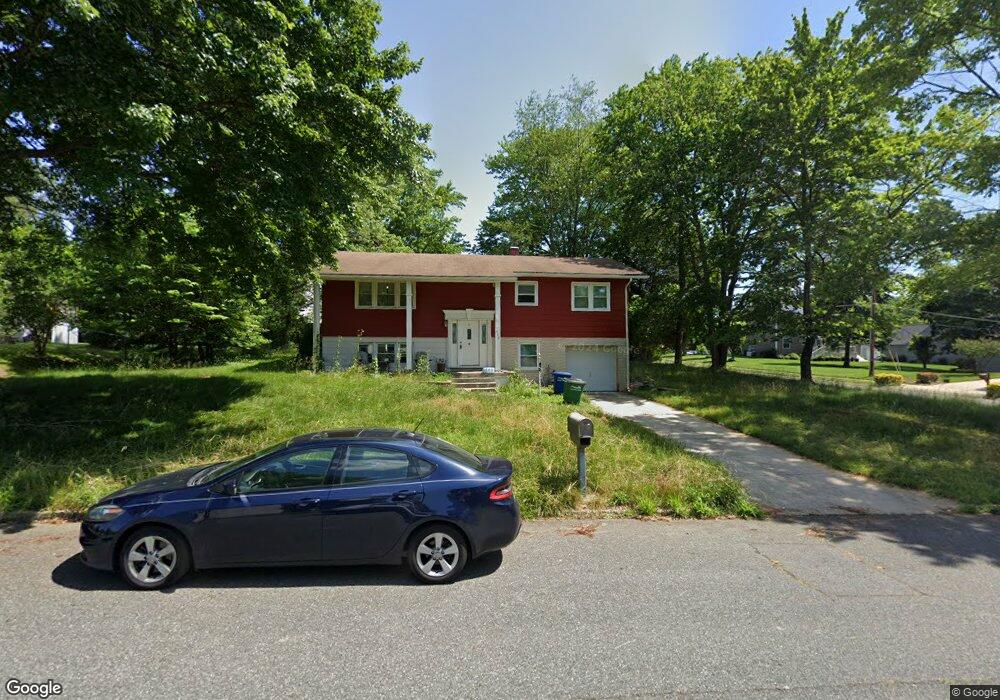
412 Wye Dr Aberdeen, MD 21001
Estimated Value: $298,021 - $363,000
--
Bed
3
Baths
1,204
Sq Ft
$283/Sq Ft
Est. Value
About This Home
This home is located at 412 Wye Dr, Aberdeen, MD 21001 and is currently estimated at $341,255, approximately $283 per square foot. 412 Wye Dr is a home located in Harford County with nearby schools including Halls Cross Roads Elementary School, Aberdeen Middle School, and Aberdeen High School.
Ownership History
Date
Name
Owned For
Owner Type
Purchase Details
Closed on
May 16, 2008
Sold by
Poplett Charles M
Bought by
Poplett Charles M
Current Estimated Value
Home Financials for this Owner
Home Financials are based on the most recent Mortgage that was taken out on this home.
Original Mortgage
$177,500
Outstanding Balance
$112,586
Interest Rate
5.91%
Mortgage Type
Purchase Money Mortgage
Estimated Equity
$228,669
Purchase Details
Closed on
Apr 29, 2008
Sold by
Poplett Charles M
Bought by
Poplett Charles M
Home Financials for this Owner
Home Financials are based on the most recent Mortgage that was taken out on this home.
Original Mortgage
$177,500
Outstanding Balance
$112,586
Interest Rate
5.91%
Mortgage Type
Purchase Money Mortgage
Estimated Equity
$228,669
Purchase Details
Closed on
May 8, 2007
Sold by
Oldl Lucille G
Bought by
Poplett Charles M
Purchase Details
Closed on
Apr 27, 2007
Sold by
Oldl Lucille G
Bought by
Poplett Charles M
Create a Home Valuation Report for This Property
The Home Valuation Report is an in-depth analysis detailing your home's value as well as a comparison with similar homes in the area
Home Values in the Area
Average Home Value in this Area
Purchase History
| Date | Buyer | Sale Price | Title Company |
|---|---|---|---|
| Poplett Charles M | $223,000 | -- | |
| Poplett Charles M | $223,000 | -- | |
| Poplett Charles M | -- | -- | |
| Poplett Charles M | -- | -- |
Source: Public Records
Mortgage History
| Date | Status | Borrower | Loan Amount |
|---|---|---|---|
| Open | Poplett Charles M | $177,500 | |
| Closed | Poplett Charles M | $177,500 |
Source: Public Records
Tax History Compared to Growth
Tax History
| Year | Tax Paid | Tax Assessment Tax Assessment Total Assessment is a certain percentage of the fair market value that is determined by local assessors to be the total taxable value of land and additions on the property. | Land | Improvement |
|---|---|---|---|---|
| 2025 | $2,222 | $248,200 | $0 | $0 |
| 2024 | $2,222 | $233,100 | $0 | $0 |
| 2023 | $2,078 | $218,000 | $78,200 | $139,800 |
| 2022 | $2,036 | $213,567 | $0 | $0 |
| 2021 | $2,059 | $209,133 | $0 | $0 |
| 2020 | $2,059 | $204,700 | $78,200 | $126,500 |
| 2019 | $2,032 | $202,000 | $0 | $0 |
| 2018 | $1,987 | $199,300 | $0 | $0 |
| 2017 | $1,960 | $196,600 | $0 | $0 |
| 2016 | -- | $196,600 | $0 | $0 |
| 2015 | $2,273 | $196,600 | $0 | $0 |
| 2014 | $2,273 | $198,800 | $0 | $0 |
Source: Public Records
Map
Nearby Homes