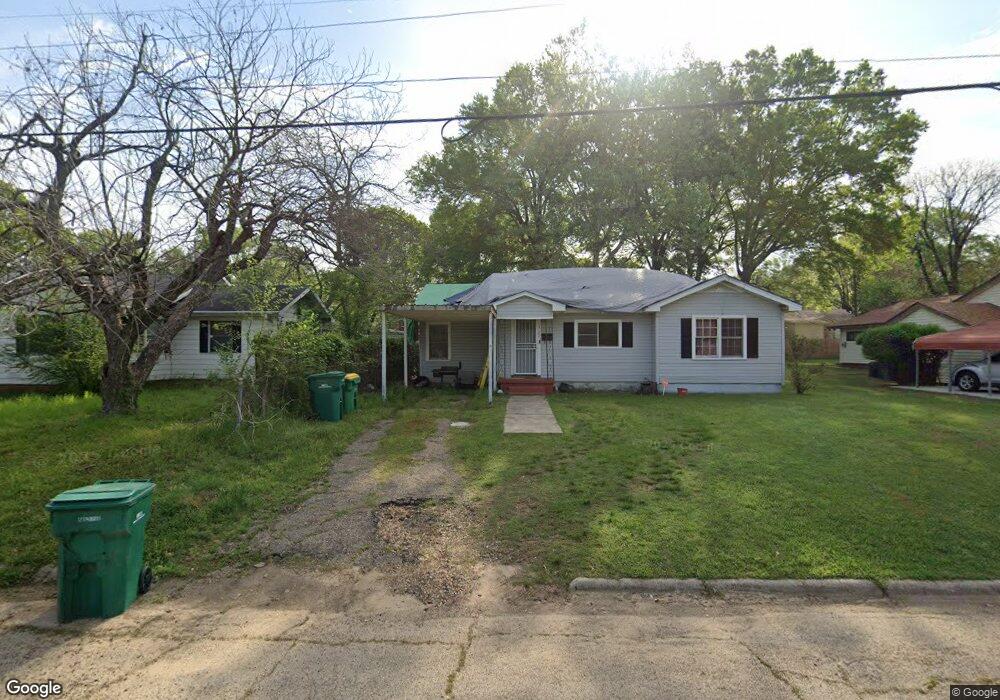
4122 Main St Texarkana, TX 75503
Estimated Value: $112,411 - $152,000
--
Bed
--
Bath
1,190
Sq Ft
$108/Sq Ft
Est. Value
About This Home
This home is located at 4122 Main St, Texarkana, TX 75503 and is currently estimated at $129,103, approximately $108 per square foot. 4122 Main St is a home located in Bowie County with nearby schools including Spring Lake Park Elementary School, Texas Middle School, and Texas High School.
Ownership History
Date
Name
Owned For
Owner Type
Purchase Details
Closed on
Jul 29, 2009
Sold by
Swartz & Brough Inc
Bought by
Carver Autumn
Current Estimated Value
Home Financials for this Owner
Home Financials are based on the most recent Mortgage that was taken out on this home.
Original Mortgage
$66,500
Interest Rate
5.31%
Mortgage Type
Purchase Money Mortgage
Purchase Details
Closed on
Jul 29, 2000
Sold by
Carver Autumn and Lockaby Barbara
Bought by
Green Tree Servicing Llc
Create a Home Valuation Report for This Property
The Home Valuation Report is an in-depth analysis detailing your home's value as well as a comparison with similar homes in the area
Home Values in the Area
Average Home Value in this Area
Purchase History
| Date | Buyer | Sale Price | Title Company |
|---|---|---|---|
| Carver Autumn | -- | None Available | |
| Green Tree Servicing Llc | $52,900 | None Available |
Source: Public Records
Mortgage History
| Date | Status | Borrower | Loan Amount |
|---|---|---|---|
| Previous Owner | Carver Autumn | $66,500 |
Source: Public Records
Tax History Compared to Growth
Tax History
| Year | Tax Paid | Tax Assessment Tax Assessment Total Assessment is a certain percentage of the fair market value that is determined by local assessors to be the total taxable value of land and additions on the property. | Land | Improvement |
|---|---|---|---|---|
| 2025 | $2,182 | $99,124 | $10,000 | $89,124 |
| 2024 | $2,182 | $92,156 | $10,000 | $82,156 |
| 2023 | $2,020 | $85,304 | $10,000 | $75,304 |
| 2022 | $1,808 | $75,726 | $8,000 | $67,726 |
| 2021 | $1,630 | $63,731 | $8,000 | $55,731 |
| 2020 | $1,593 | $61,982 | $8,000 | $53,982 |
| 2019 | $1,588 | $59,537 | $8,000 | $51,537 |
| 2018 | $1,538 | $57,654 | $8,000 | $49,654 |
| 2017 | $1,509 | $56,736 | $8,000 | $48,736 |
| 2016 | $1,547 | $58,143 | $8,000 | $50,143 |
| 2015 | $1,445 | $57,676 | $8,000 | $49,676 |
| 2014 | $1,445 | $55,869 | $8,000 | $47,869 |
Source: Public Records
Map
Nearby Homes