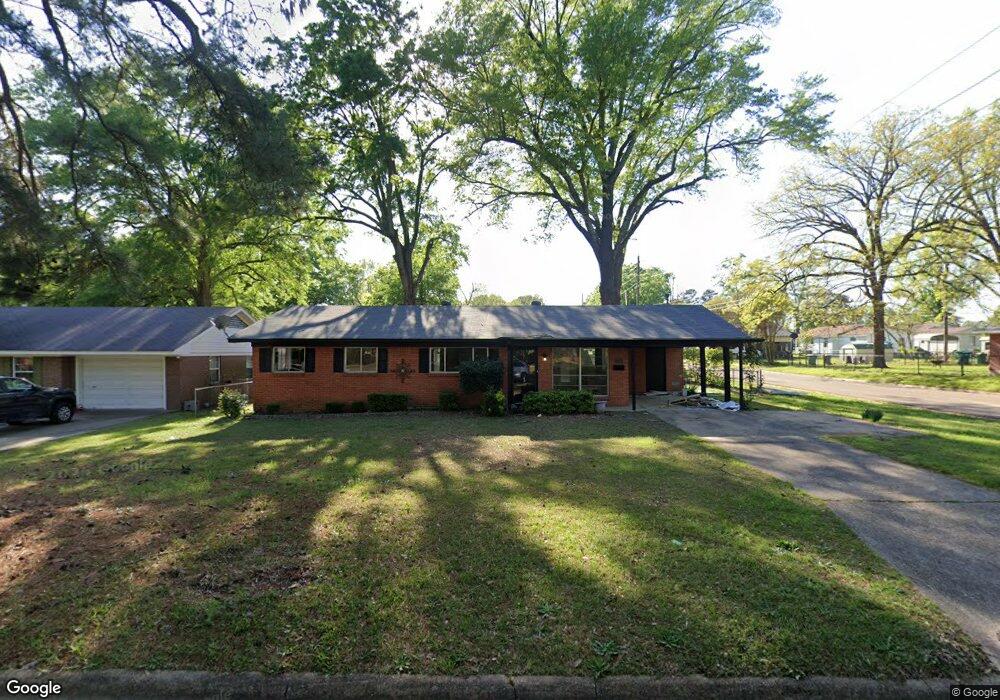
4125 Olive St Texarkana, TX 75503
Estimated Value: $155,000 - $160,012
3
Beds
2
Baths
1,454
Sq Ft
$108/Sq Ft
Est. Value
About This Home
This home is located at 4125 Olive St, Texarkana, TX 75503 and is currently estimated at $157,003, approximately $107 per square foot. 4125 Olive St is a home located in Bowie County with nearby schools including Spring Lake Park Elementary School, Texas Middle School, and Texas High School.
Ownership History
Date
Name
Owned For
Owner Type
Purchase Details
Closed on
Sep 11, 2024
Sold by
Robbins Carrie Dee
Bought by
Moore James R and Moore Peggy D
Current Estimated Value
Purchase Details
Closed on
Oct 3, 2017
Sold by
Quillin Samantha
Bought by
Robbins Carrie Dee
Home Financials for this Owner
Home Financials are based on the most recent Mortgage that was taken out on this home.
Original Mortgage
$74,500
Interest Rate
3.86%
Mortgage Type
Purchase Money Mortgage
Purchase Details
Closed on
Jan 23, 2009
Sold by
Rankin Kathryn
Bought by
Quillin Samantha
Home Financials for this Owner
Home Financials are based on the most recent Mortgage that was taken out on this home.
Original Mortgage
$83,028
Interest Rate
5.09%
Mortgage Type
FHA
Create a Home Valuation Report for This Property
The Home Valuation Report is an in-depth analysis detailing your home's value as well as a comparison with similar homes in the area
Home Values in the Area
Average Home Value in this Area
Purchase History
| Date | Buyer | Sale Price | Title Company |
|---|---|---|---|
| Moore James R | -- | None Listed On Document | |
| Robbins Carrie Dee | -- | None Available | |
| Quillin Samantha | -- | None Available |
Source: Public Records
Mortgage History
| Date | Status | Borrower | Loan Amount |
|---|---|---|---|
| Previous Owner | Robbins Carrie Dee | $74,500 | |
| Previous Owner | Quillin Samantha | $83,028 |
Source: Public Records
Tax History Compared to Growth
Tax History
| Year | Tax Paid | Tax Assessment Tax Assessment Total Assessment is a certain percentage of the fair market value that is determined by local assessors to be the total taxable value of land and additions on the property. | Land | Improvement |
|---|---|---|---|---|
| 2025 | $968 | $130,327 | $12,500 | $117,827 |
| 2024 | $968 | $116,073 | $12,500 | $114,482 |
| 2023 | $968 | $105,521 | $0 | $0 |
| 2022 | $2,290 | $103,712 | $10,000 | $93,712 |
| 2021 | $2,230 | $87,207 | $10,000 | $77,207 |
| 2020 | $2,233 | $86,870 | $10,000 | $76,870 |
| 2019 | $2,222 | $83,304 | $10,000 | $73,304 |
| 2018 | $2,149 | $80,567 | $10,000 | $70,567 |
| 2017 | $2,107 | $79,223 | $10,000 | $69,223 |
| 2016 | $2,237 | $84,104 | $10,000 | $74,104 |
| 2015 | $1,748 | $83,394 | $10,000 | $73,394 |
| 2014 | $1,748 | $78,202 | $10,000 | $68,202 |
Source: Public Records
Map
Nearby Homes
- 4111 Olive St
- 4201 Olive St
- 4116 Elizabeth St
- 4107 Olive St
- 4202 Olive St
- 4114 Elizabeth St
- 4120 Olive St
- 4116 Olive St
- 4110 Elizabeth St
- 4204 Elizabeth St
- 4202 Elizabeth St
- 4112 Olive St
- 4206 Elizabeth St
- 4206 Olive St
- 4207 Olive St
- 4105 Olive St
- 4106 Elizabeth St
- 4208 Elizabeth St
- 4201 Elizabeth St
- 4104 Olive St