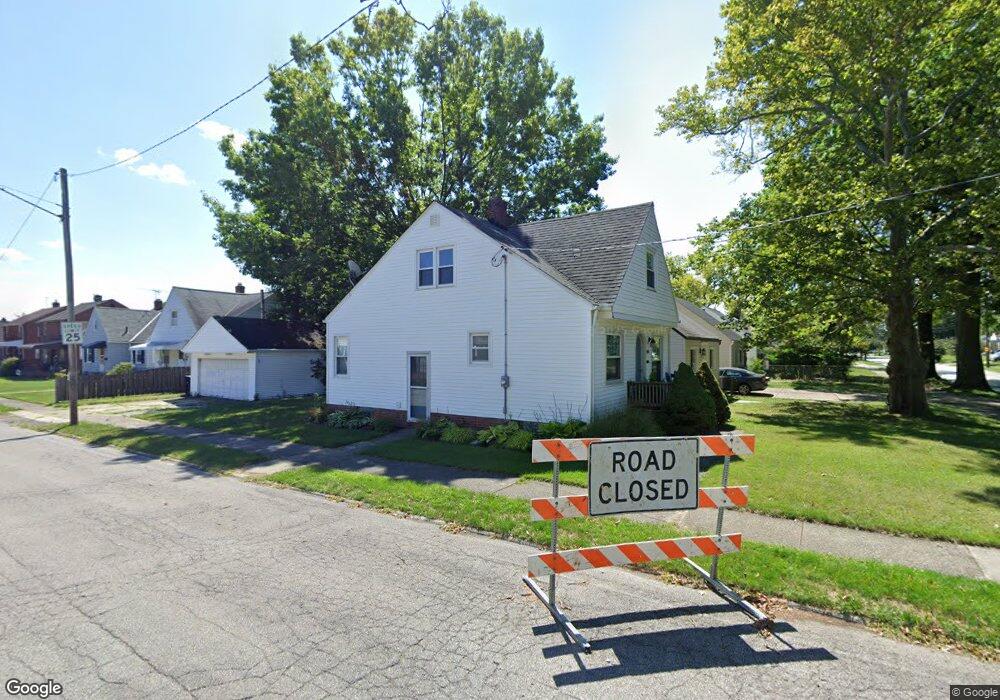
4129 W 143rd St Cleveland, OH 44135
Jefferson NeighborhoodEstimated Value: $136,821 - $173,000
4
Beds
1
Bath
1,152
Sq Ft
$137/Sq Ft
Est. Value
About This Home
This home is located at 4129 W 143rd St, Cleveland, OH 44135 and is currently estimated at $157,455, approximately $136 per square foot. 4129 W 143rd St is a home located in Cuyahoga County with nearby schools including Artemus Ward School, Almira Academy, and Benjamin Franklin.
Ownership History
Date
Name
Owned For
Owner Type
Purchase Details
Closed on
Apr 14, 1998
Sold by
Macho James P and Macho Grant Guy
Bought by
Metzger Mark S
Current Estimated Value
Home Financials for this Owner
Home Financials are based on the most recent Mortgage that was taken out on this home.
Original Mortgage
$78,937
Interest Rate
7.27%
Mortgage Type
FHA
Purchase Details
Closed on
Feb 13, 1998
Sold by
Flowers Dwaine
Bought by
Macho James P and Grant Guy
Home Financials for this Owner
Home Financials are based on the most recent Mortgage that was taken out on this home.
Original Mortgage
$78,937
Interest Rate
7.27%
Mortgage Type
FHA
Purchase Details
Closed on
Jul 27, 1993
Sold by
Flowers Dwaine
Bought by
Flowers April
Purchase Details
Closed on
Feb 17, 1988
Sold by
Vargo John Michael
Bought by
Flowers Dwaine
Purchase Details
Closed on
Jul 30, 1984
Sold by
Vargo John M
Bought by
Vargo John Michael
Purchase Details
Closed on
Jan 16, 1979
Sold by
Kirkpatrick Robt J and Kirkpatrick Betty L
Bought by
Vargo John M
Purchase Details
Closed on
Jan 1, 1975
Bought by
Kirkpatrick Robt J and Kirkpatrick Betty L
Create a Home Valuation Report for This Property
The Home Valuation Report is an in-depth analysis detailing your home's value as well as a comparison with similar homes in the area
Home Values in the Area
Average Home Value in this Area
Purchase History
| Date | Buyer | Sale Price | Title Company |
|---|---|---|---|
| Metzger Mark S | $78,900 | -- | |
| Macho James P | $42,500 | -- | |
| Flowers April | -- | -- | |
| Flowers Dwaine | $43,000 | -- | |
| Vargo John Michael | -- | -- | |
| Vargo John M | $42,000 | -- | |
| Kirkpatrick Robt J | -- | -- |
Source: Public Records
Mortgage History
| Date | Status | Borrower | Loan Amount |
|---|---|---|---|
| Previous Owner | Metzger Mark S | $78,937 |
Source: Public Records
Tax History Compared to Growth
Tax History
| Year | Tax Paid | Tax Assessment Tax Assessment Total Assessment is a certain percentage of the fair market value that is determined by local assessors to be the total taxable value of land and additions on the property. | Land | Improvement |
|---|---|---|---|---|
| 2024 | $2,871 | $43,785 | $8,050 | $35,735 |
| 2023 | $2,528 | $33,330 | $5,640 | $27,690 |
| 2022 | $2,514 | $33,320 | $5,635 | $27,685 |
| 2021 | $2,488 | $33,320 | $5,640 | $27,690 |
| 2020 | $2,232 | $25,830 | $4,380 | $21,460 |
| 2019 | $2,063 | $73,800 | $12,500 | $61,300 |
| 2018 | $1,935 | $25,830 | $4,380 | $21,460 |
| 2017 | $1,830 | $22,190 | $3,500 | $18,690 |
| 2016 | $1,816 | $22,190 | $3,500 | $18,690 |
| 2015 | $1,918 | $22,190 | $3,500 | $18,690 |
| 2014 | $1,918 | $23,350 | $3,680 | $19,670 |
Source: Public Records
Map
Nearby Homes
- 14434 Cleminshaw Rd
- 14212 Leroy Ave
- 14511 Saint James Ave
- 14513 Mission Rd
- 4046 W 143rd St
- 13904 Highlandview Ave
- 4162 Victory Blvd
- 13810 Clifford Ave
- 14315 Viola Ave
- 13818 Courtland Ave
- 3922 W 143rd St
- 4322 W 138th St
- 13921 Wainstead Ave
- 13716 Tyler Ave
- 14128 Lakota Ave
- 13402 Saint James Ave
- 13514 Tyler Ave
- 14319 Fairlawn Ave
- 13313 Highlandview Ave
- 13910 Lyric Ave
- 4133 W 143rd St
- 4137 W 143rd St
- 4121 W 143rd St
- 4137 W 143 2-3fb
- 14213 Liberty Ave
- 4141 W 143rd St
- 4117 W 143rd St
- 14211 Liberty Ave
- 14212 Liberty Ave
- 4145 W 143rd St
- 4113 W 143rd St
- 14205 Liberty Ave
- 14208 Liberty Ave
- 4128 W 143rd St
- 14212 Highlandview Ave
- 4132 W 143rd St
- 4124 W 143rd St
- 4136 W 143rd St
- 4149 W 143rd St
- 14208 Highlandview Ave